
Market Brief
Broward County condos had 10.6 months of supply in October 2026 against 4.4 months for houses, even as condo listings fell for a ninth straight month to 9,814 and cash buyers paid for 52.7% of condo sales, according to MIAMI REALTORS + RWorld.
Broward condo supply stood at 10.6 months in October versus 4.4 for houses. Condo listings fell to 9,814 and 52.7% of condo sales were cash.
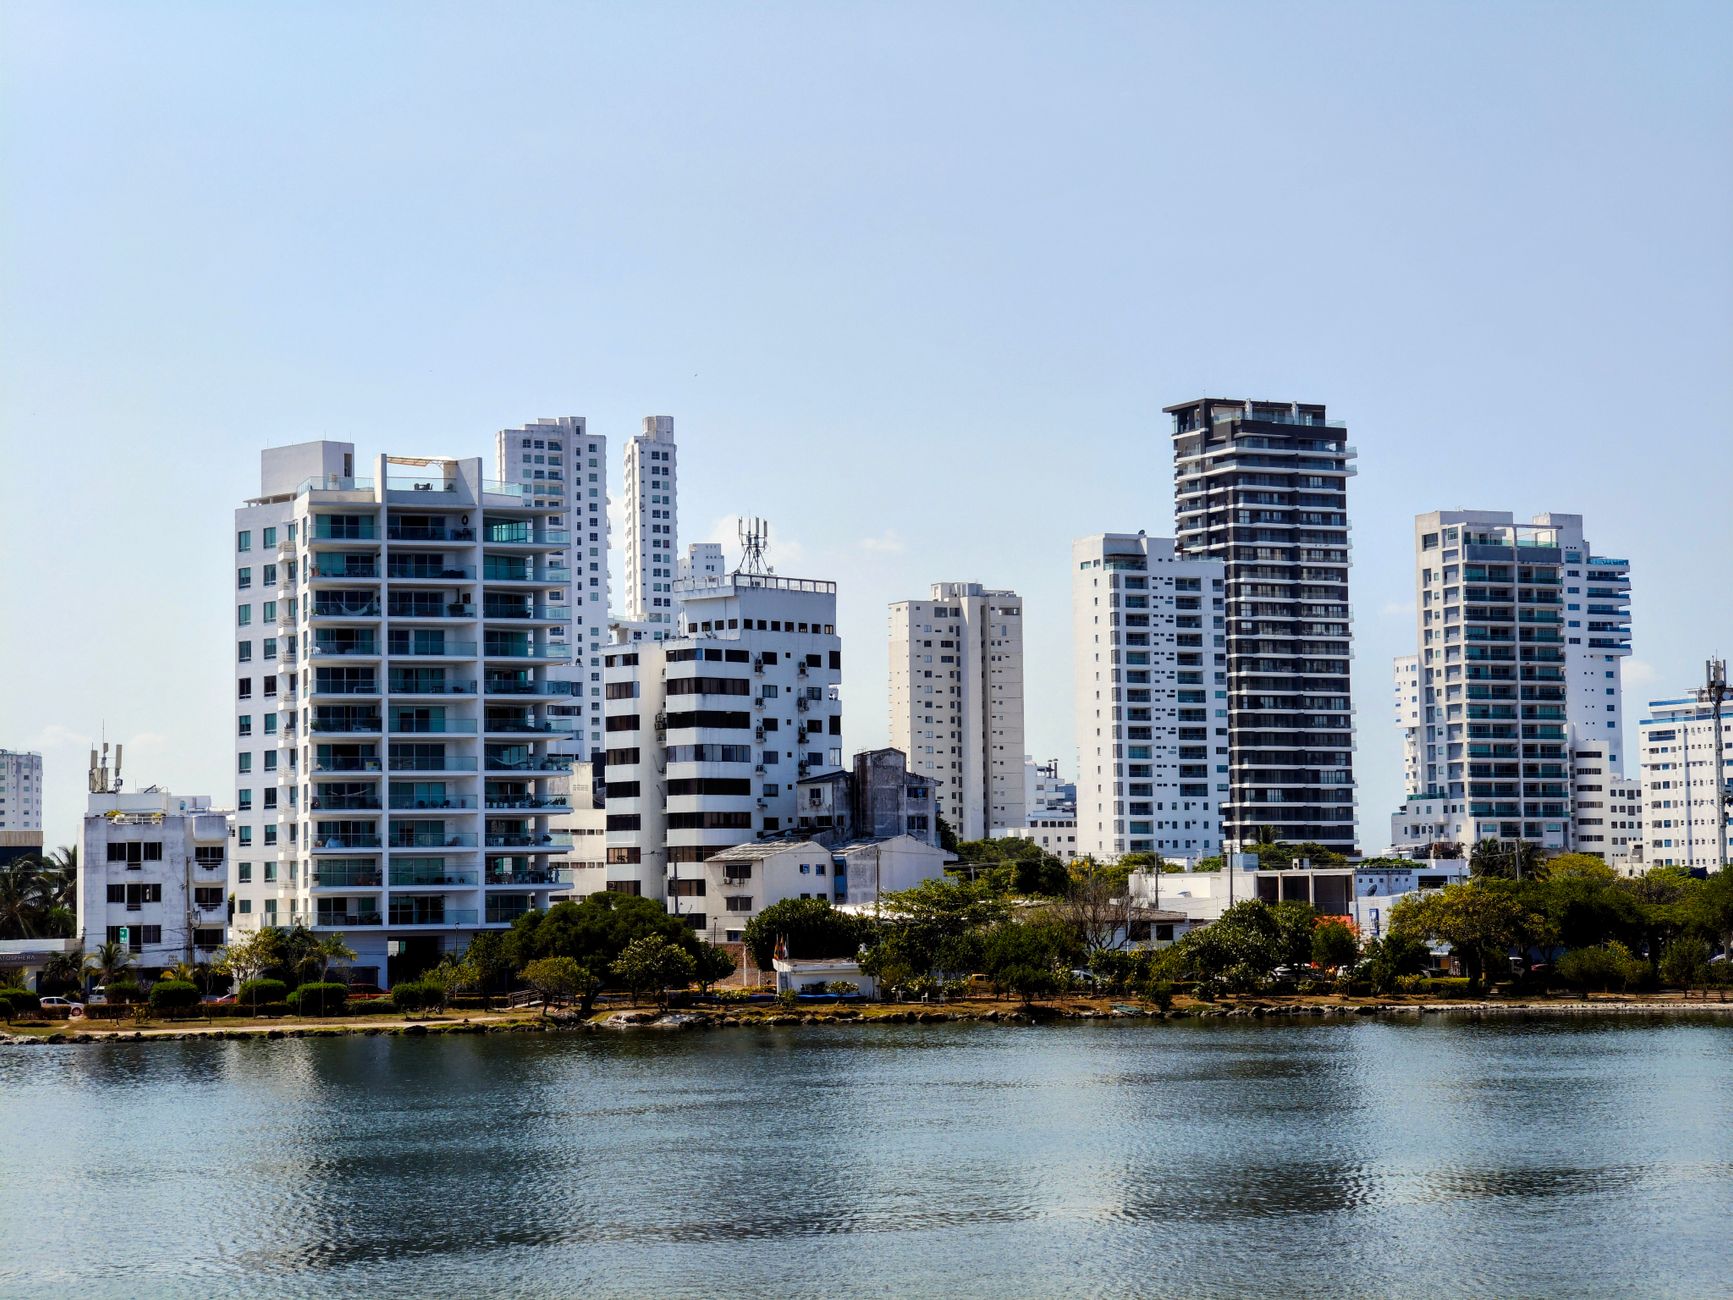
Broward County condos carried 10.6 months of supply in October 2026, against 4.4 months for single-family homes, according to MIAMI REALTORS + RWorld's Broward October report, published November 16. Condo listings fell 11.03% to 9,814, the ninth straight monthly decline, and total active listings dropped to 14,281 from 16,395. Cash buyers paid for 52.7% of condo sales and 38.8% of all closings.
This piece looks at the gap between the condo and house segments in October. Completed-month prices, pace and closed sales for the area are on the Fort Lauderdale market data hub.
How much inventory does Broward County have?
| Measure | October 2026 | October 2025 | Change |
|---|---|---|---|
| Total active listings | 14,281 | 16,395 | -12.8% |
| Single-family inventory | 4,467 | 5,364 | -16.72% |
| Condo inventory | 9,814 | 11,031 | -11.03% |
| Months of supply, single-family | 4.4 | ||
| Months of supply, condo | 10.6 |
Source: MIAMI REALTORS + RWorld, Broward County October 2026 report, November 16, 2026.
Both segments have fewer listings than a year ago, and total inventory has now declined for nine straight months, per the association. The difference is in scale. Broward has more than twice as many condos for sale as houses, so condo supply stays long even after a year of shrinking listings. The association treats six to nine months as balanced, which puts houses on the seller's side and condos on the buyer's side.
Why is Broward condo supply so much longer than house supply?
Sales did not keep pace with listings in either segment, but condos started from a larger pool.
| Measure | October 2026 | October 2025 | Change |
|---|---|---|---|
| Total home sales | 1,750 | 2,011 | -12.9% |
| Single-family sales | 892 | 1,037 | -13.9% |
| Condo sales | 858 | 974 | -11.91% |
| Total dollar volume | about $1 billion | -9.63% | |
| Condo dollar volume | $279 million | -15.95% |
Source: MIAMI REALTORS + RWorld, October 2026.
Condos made up about 49% of October closings, our arithmetic from the reported counts, yet about 69% of active listings. The report also points to lending limits. It says only 21 of 2,397 condo buildings in Miami-Dade, Broward and Palm Beach counties are approved for FHA loans, citing HUD, and that Fannie Mae and Freddie Mac ended the limited review option for many condo loans on August 3, 2026. A building that does not qualify for those loan programs narrows the set of buyers who can finance a unit there.
Who is paying cash for Broward condos?
Cash buyers paid for 52.7% of condo sales in October, compared with 25.4% of house sales. Across all closings the cash share was 38.8%, up from 37.2% a year earlier. Distressed sales stayed rare at 1.2% of closed residential sales, split between 0.5% short sales and 0.7% bank-owned sales.
A majority cash share fits the lending picture above: a cash buyer does not need a building to pass a lender's review. Our Broward condos under contract piece looks at which condo listings found buyers this fall, and the Birch Road tower piece covers an older beach building being replaced with new condos.
Are Broward condo prices falling?
The association's condo median was $240,300 in October, down 7.22% from $259,000. The single-family median was $610,000, down 0.20% from $611,250. The median condo sold at 92% of its original list price and the median house at 96%, so condo sellers gave up more ground from their first asking price.
Condos still moved faster than a year earlier. The median condo went under contract in 65 days, against 77 in October 2025, and the median house in 41 days, against 55. Our Broward price cuts and contracts piece covers how reductions have played into that pace.
What does this mean for buyers and sellers?
For condo buyers, 9,814 listings and 10.6 months of supply mean time to compare buildings, association fees, reserve funding and inspection status before making an offer. Buyers who need a loan should ask early whether a building meets FHA, Fannie Mae or Freddie Mac rules. For condo sellers, a buyer pool that leans more than half on cash and a 92% median sale-to-list ratio point to pricing and paperwork as the levers that matter. House sellers face 4.4 months of supply and fewer competing listings than a year ago.
The association's chief economist expects sales to stay subdued through year-end with mortgage rates above 7%; the report cites rates at 7.42% in November. Current listings are on the Fort Lauderdale, Hollywood, Pompano Beach and Coral Springs pages. For the same split one county north, see our Palm Beach County condo sales piece.
People also ask
How many months of condo supply does Broward County have?
Broward County had 10.6 months of condo supply in October 2026, against 4.4 months for single-family homes, according to MIAMI REALTORS + RWorld.
How many condos are for sale in Broward County?
Broward had 9,814 condos for sale at the end of October 2026, down 11.03% from 11,031 a year earlier, the ninth straight monthly decline.
What share of Broward condo sales are cash?
Cash buyers paid for 52.7% of Broward condo sales in October 2026, compared with 25.4% of single-family sales and 38.8% of all closings.
How many Broward condo buildings are FHA approved?
The association report says 21 of 2,397 condo buildings across Miami-Dade, Broward and Palm Beach counties are FHA approved, citing HUD. It does not give a Broward-only count.
Limitations
All figures come from one association report built from MLS records for Broward County; they cover one month and are subject to revision. The report excludes new construction and pre-construction sales not recorded in the MLS. It did not print year-ago months of supply or dollar volumes, so those cells are blank. The condo shares of sales and listings and the days-saved comparisons are our arithmetic from reported numbers. The FHA building count covers three counties. Association medians count closings differently from our Market Pulse, so the two will not match.
Sources
- Broward Real Estate Market Shows Resilience Through October, MIAMI REALTORS + RWorld, November 16, 2026.
- Fort Lauderdale market data hub, Momentum Research.
Disclosure: Jon Brooks is a co-founder of Momentum Realty, a Florida real estate brokerage that owns and funds Florida Housing Intelligence. Momentum has a financial interest in Florida real estate transactions, including in markets named here. See our editorial standards.
Market statistics in this article are computed from MLS data licensed by Momentum Realty, and are current as of the date shown. Data may be preliminary and subject to revision by its source. This article is general information, not advice about any specific property, transaction, or financial decision, and is not a representation about any specific property, community, builder, or association.
Equal Housing Opportunity. Editorial standards · Corrections · About