
Data Analysis
Broward County sellers cut asking prices 2,003 times from October 20 to November 2, 2026, while 801 active listings went into a contract, about 2.5 cuts per contract, as condo contracts fell 14 percent.
Our Beaches MLS feed logged 2,003 Broward price cuts and 801 new contracts in two weeks. Condo cuts ran deepest at a median 4.2 percent.
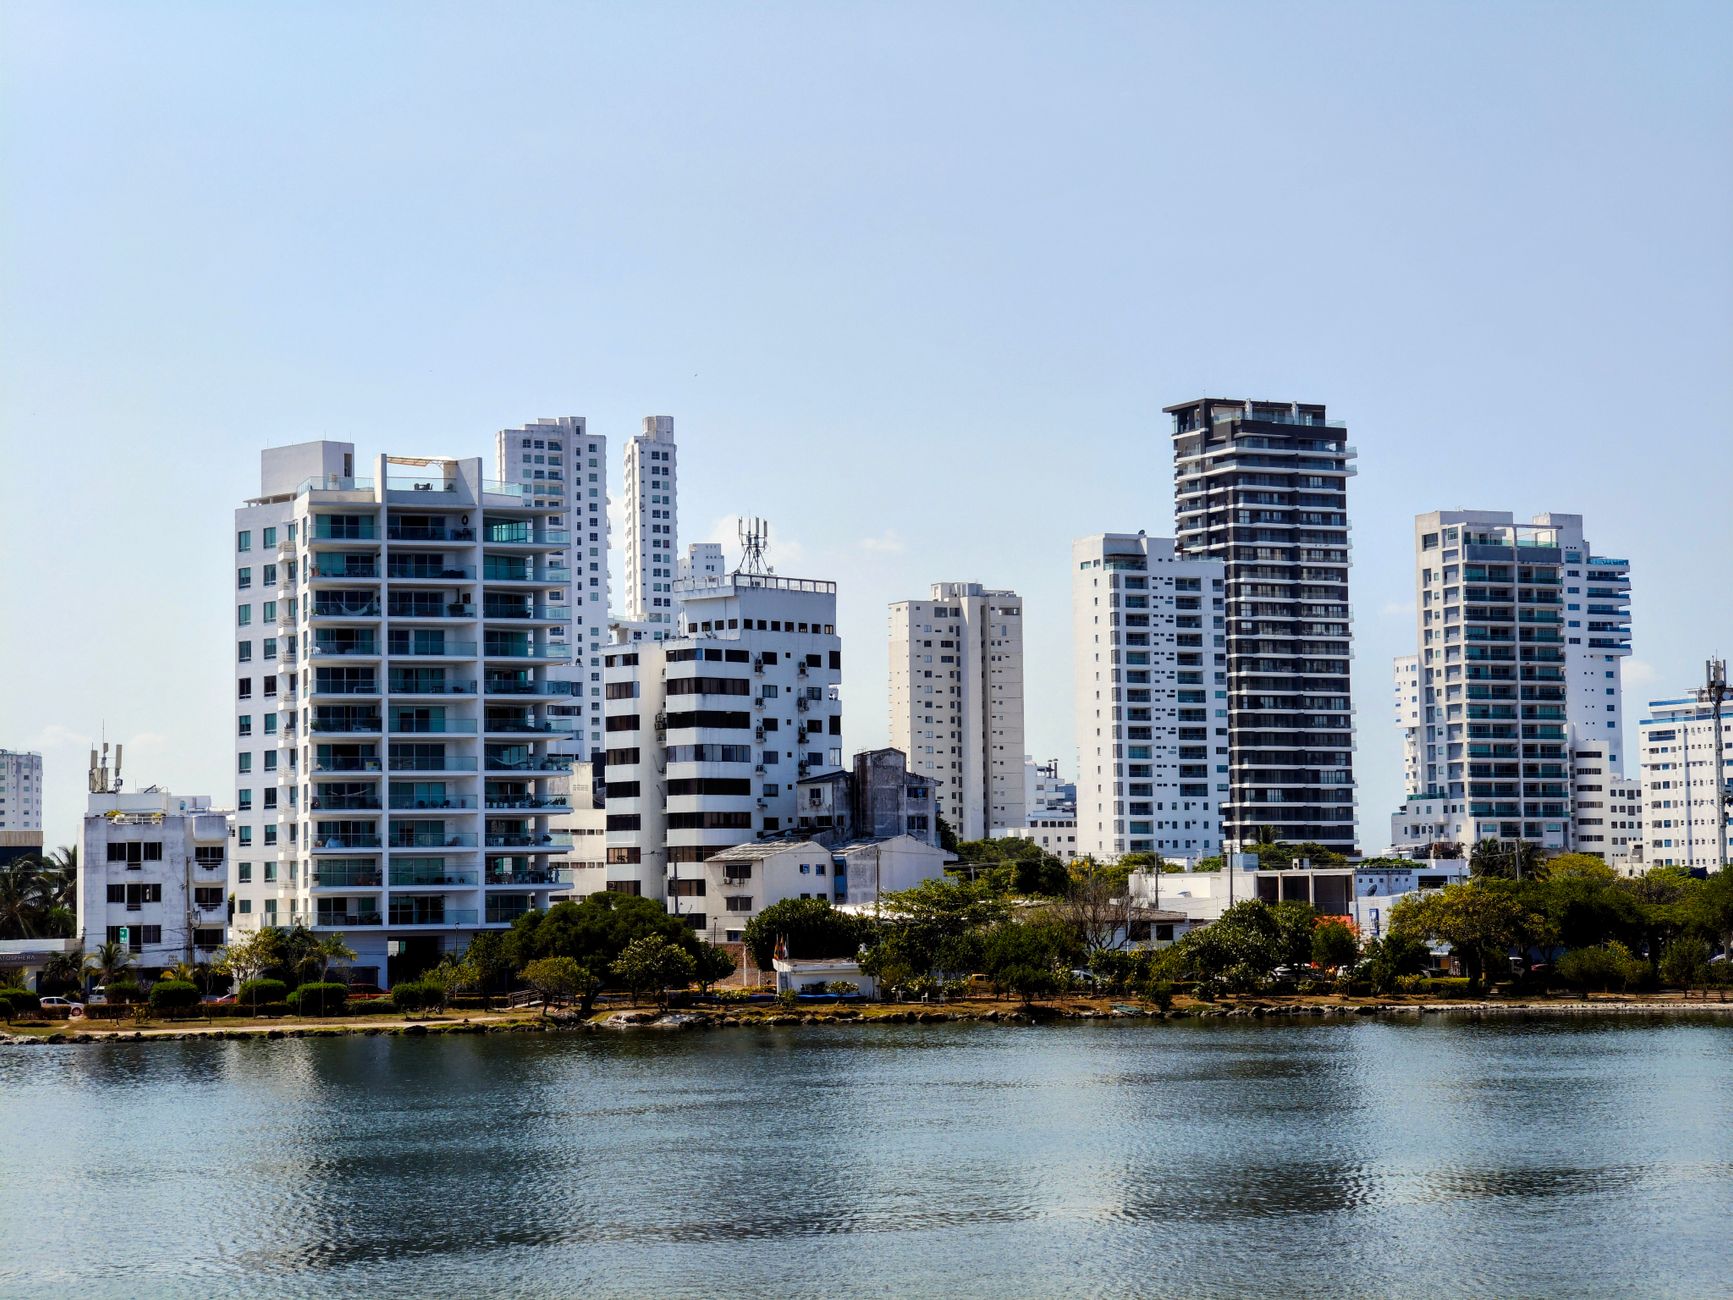
From October 20 through November 2, 2026, our live Beaches MLS feed logged 2,003 price cuts in Broward County against 801 active listings going into a contract, about 2.5 cuts per contract. In the prior two weeks, October 6 to 19, the feed logged 2,071 cuts and 850 contracts, about 2.4 per contract. Condo contracts fell from 319 to 274, down 14 percent, while townhome contracts rose from 77 to 93. The median cut was 3.4 percent, or $11,100, and condo cuts ran deepest at 4.2 percent. All figures are ours, computed from Beaches MLS records; information is deemed reliable but not guaranteed.
This is a two-week read on price cuts and contract pace across all property types. Our October 29 article on Broward condos under contract covered the condo market in depth, our October 26 piece on listings pulled off the market covered withdrawals, and our November 2 article on Miramar Cove and southwest Broward covered Miramar. Completed-month prices are in our Fort Lauderdale price per square foot article and on the Fort Lauderdale market data hub.
Which property types saw the most price cuts?
Condos and single-family houses each logged more than 800 cuts. Condos drew fewer contracts per cut.
| Property type | Price cuts | New contracts | Contracts Oct 6-19 | Cuts per contract | Median cut |
|---|---|---|---|---|---|
| Condo | 933 | 274 | 319 | 3.4 | 4.2% ($10,000) |
| Single-family | 806 | 405 | 416 | 2.0 | 2.9% ($20,000) |
| Townhome | 190 | 93 | 77 | 2.0 | 2.3% ($10,000) |
Source: Momentum Research, computed from Beaches MLS records, Broward County, October 20 to November 2, 2026, with prior-window contracts from October 6 to 19. Contracts count active listings that moved to active under contract or pending. Deemed reliable but not guaranteed.
Condos also added the most supply. New condo listings totaled 1,175 in the window, against 1,022 for single-family houses and 260 for townhomes.
Where in Broward did sellers cut the most?
By the listing's city, the largest places logged cuts at two to three times their contract count:
| City | Price cuts | New contracts | Contracts Oct 6-19 | New listings |
|---|---|---|---|---|
| Fort Lauderdale | 280 | 106 | 107 | 464 |
| Hollywood | 185 | 60 | 67 | 226 |
| Pembroke Pines | 143 | 61 | 75 | 174 |
| Pompano Beach | 138 | 53 | 53 | 183 |
| Deerfield Beach | 102 | 41 | 59 | 125 |
| Tamarac | 97 | 52 | 51 | 128 |
| Coral Springs | 93 | 39 | 41 | 115 |
| Margate | 90 | 34 | 28 | 63 |
| Hallandale Beach | 88 | 29 | 20 | 121 |
Source: Momentum Research, computed from Beaches MLS records, Broward County, October 6 to November 2, 2026. Deemed reliable but not guaranteed.
Margate stood out. Its condos logged 51 cuts against 11 contracts in the second window, up from 29 cuts in the first. Deerfield Beach contracts fell from 59 to 41. Hallandale Beach condo contracts rose from 16 to 23, though cuts there still outnumbered contracts about three to one.
Do price cuts differ by price range?
Homes listed under $300,000 logged the most cuts, 729, against 240 contracts, about 3.0 per contract; most of that band is condos. From $300,000 to $399,999 the ratio was 1.9, the lowest of any band, with 244 cuts and 129 contracts. Between $400,000 and $999,999 it ran near 2.4. At $2 million and up, 75 cuts met 27 contracts, about 2.8. The band uses the price before the cut.
How much supply is on the market?
Our live map on November 3 showed 13,570 active Broward listings against 2,640 pending or under contract, about 5.1 to 1. Condos ran at 8.3 to 1 (7,667 against 921). Single-family houses ran at 3.1 to 1 and townhomes at 4.0. By city, Coral Springs ran at 3.5, Weston at 3.6 and Tamarac at 3.7, while Hollywood ran at 7.4 and Hallandale Beach at 11.2. The median active listing had been on the market about 81 days, and 2,995 had been listed 180 days or more.
What does this mean for buyers and sellers?
For condo buyers, a cut-heavy market means room to negotiate on price, but the full cost includes association dues, special assessments and insurance. Our Fort Lauderdale home insurance page, the Broward County property tax page and the Fort Lauderdale flood zones by neighborhood page cover those costs.
For single-family sellers, cuts ran two per contract with a median of $20,000. Pricing near the $300,000 to $399,999 band or in Coral Springs, Weston or Tamarac drew the quickest response. Recent cut history by community is on our Broward County price cuts page.
People also ask
Are Fort Lauderdale area home prices dropping?
Asking prices are being cut often. Our feed logged 2,003 price cuts in Broward County from October 20 to November 2, 2026, about 2.5 per new contract, with a median cut of 3.4 percent. Closed-sale prices are reported monthly on our Fort Lauderdale market data hub.
How much are Broward sellers cutting prices?
The median cut from October 20 to November 2, 2026 was 3.4 percent, or $11,100. Condo cuts had a median of 4.2 percent, single-family cuts 2.9 percent, or $20,000, and townhome cuts 2.3 percent.
Are Broward condos harder to sell than houses?
On November 3, 2026, Broward condos ran at 8.3 active listings per contract, against 3.1 for single-family houses. Condo contracts fell from 319 to 274 between the two windows while house contracts held near 410.
Limitations
Counts come from the change log of our live Beaches MLS feed, which records a change when our refresh sees it; refreshes are lighter on weekends. Contracts count only active listings that moved to active under contract or pending. A listing that changed more than once in a category within a window is counted once; the median cut uses every recorded cut. City follows the listing's mailing city. The live map counts by city name and can differ from monthly inventory figures. Contracts can fall through, and 144 went back on the market in the second window.
Sources
- Momentum Research, computed from Beaches MLS records, Broward County (listing change log, October 6 to November 2, 2026; live map snapshot, November 3, 2026). Information is deemed reliable but is not guaranteed by the MLS to be accurate.
- Momentum Research, Beaches Market Pulse.
- Full monthly series and per-feed attribution: Fort Lauderdale market data
Disclosure: Jon Brooks is a co-founder of Momentum Realty, a Florida real estate brokerage that owns and funds Florida Housing Intelligence. Momentum has a financial interest in Florida real estate transactions, including in markets named here. See our editorial standards.
Market statistics in this article are computed from MLS data licensed by Momentum Realty, and are current as of the date shown. Data may be preliminary and subject to revision by its source. This article is general information, not advice about any specific property, transaction, or financial decision, and is not a representation about any specific property, community, builder, or association.
Equal Housing Opportunity. Editorial standards · Corrections · About