
Clermont
Homes for Sale in Naples, FL
True comps, carrying-cost math, and listings before the portals.
Market Heat
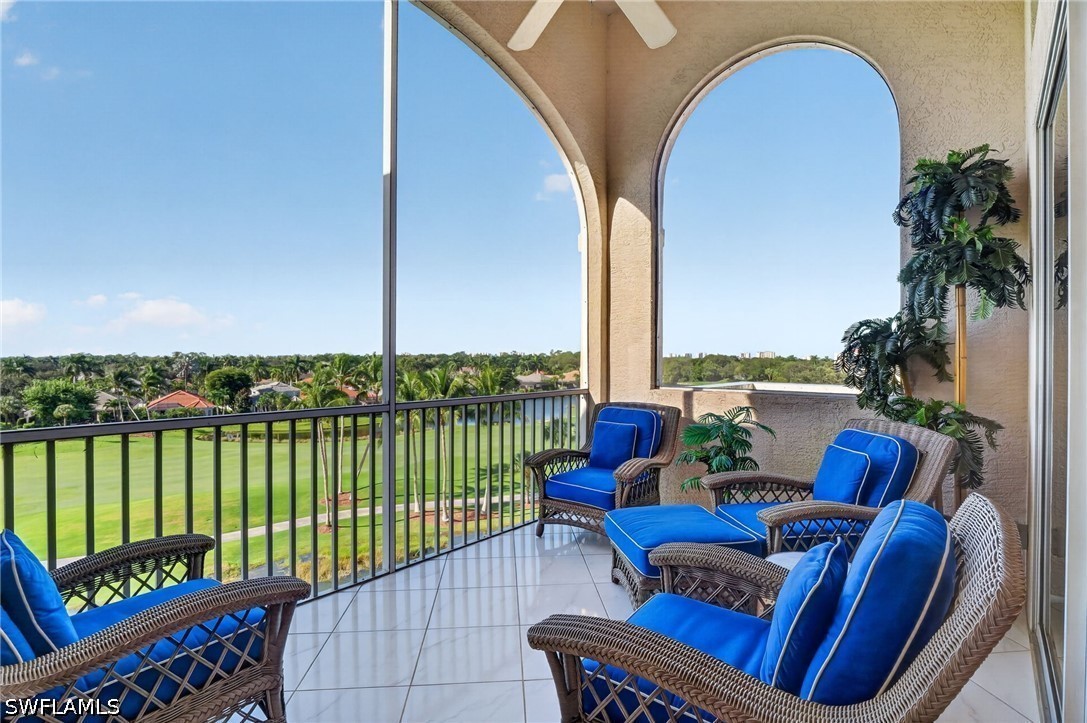
Photo via Florida Gulf Coast MLS
Homes For Sale Right Now in Clermont
Live MLS inventory for Clermont. Every active listing, what is under contract right now, and the last 12 months of closed sales, refreshed twice a day. Closed comps beat an algorithm's guess every time.
Active and pending Clermont listings as of 2026-10-23, priced high to low. Listing information provided by the Florida Gulf Coast Multiple Listing Service, Inc. Information is deemed reliable but not guaranteed by the MLS to be accurate. Tap any home to ask about it.

Clermont's pricing right now is being set by patience, not urgency. A median of $614,950 against a $348-per-square-foot rate tells you the value is still there, but the median 112.5-day time on market says buyers are taking their time and sellers are having to earn the number they want rather than assume it.
The 12.2% year-over-year pullback combined with a market heat score of 18 points to a buyer-leaning window over this closings cycle. For sellers, that means pricing at or near comparable-sold levels from day one; for buyers, it means there is room to negotiate on condition, terms, and closing timeline rather than racing another offer.
Figures in this note are as of July 29, 2026. The live market numbers elsewhere on this page update nightly and are newer.
Clermont right now
🟡 Balanced market. 6.0 months of supply and 33% of the inventory already under contract put buyers and sellers on roughly even footing.Why it matters: months of supply is how long today's inventory would last at today's sales pace; under-contract share is the portion of homes for sale that already have a buyer.Momentum Research analysis of Florida Gulf Coast MLS records, as of September 20, 2026. Confidence: High (9 active and pending listings, 13 closed sales in 12 months).
🔴 Off the recent peak. The trailing-12-month median ($640K) is down 8.6% from the prior 12 months ($700K). With about a dozen sales a year, a single closing can swing this number, so read the level and the decade, not one year's move.Momentum Research, record-level Florida Gulf Coast MLS closed sales, 12-month windows ending September 20. Confidence: Medium (13 and 7 sales in the two windows).
Jump to: Price history & scorecard · Homes for sale · Schools · FAQ
· Updated September 20, 2026 · Live data: Florida Gulf Coast MLS, refreshed twice daily · MLS facts carry their source; interpretation lines are Momentum Research · Data sources & freshness
The 60-Second Overview
Clermont market snapshot (as of September 20, 2026): the median sale price is about $640K ($358 per sq ft over the trailing 12 months of closed sales), a median 116 days on market for closed sales, and 6.0 months of supply, a balanced market. The trailing-12-month median is down 9% from the prior 12 months, computed from record-level Florida Gulf Coast MLS closed sales (13 closings in the current window).
Clermont sits within Naples in Collier County, an area where recent closings show a wider gap between list expectations and what the market is actually paying, reflected in both the extended time on market and the downward price movement over the past year.
Who Clermont is best for.
Best for
- A buyer with flexible timing who wants negotiating leverage on price and terms
- A seller prepared to price against current 12-month closings data rather than prior-year highs
- An investor comfortable with a longer hold given the current pace of sales
Probably not for
- A seller who needs a quick, above-list sale in a short window
- A buyer expecting multiple-offer competition or rapid appreciation
- Anyone relying on last year's price levels to set today's budget
Price History: What Homes Here Have Actually Sold For
Median sale price over the trailing 12 months ending September 20 of each year, from record-level Florida Gulf Coast MLS closed sales. Same methodology as every appreciation figure on this page: the 2026 point ($640K) IS the median in the snapshot above, and the move from 2025 ($700K) IS the -8.6% one-year change.
Windows contain 1 to 15 sales each (13 in the current window); every figure carries its sample size, and thin markets swing on single closings. Listing information provided by the Florida Gulf Coast Multiple Listing Service, Inc. Information is deemed reliable but not guaranteed by the MLS to be accurate. Deemed reliable but not guaranteed.
19% of homes for sale in ZIP 34109 are already under contract (under contract ÷ under contract + active listings) — a read on how much of the available inventory buyers have already claimed. Source: MLS data (2026-09-20).
Clermont Market Scorecard
Clermont is currently a balanced market. About 6.0 months of supply, a median asking price of $522,500, and homes go under contract in about 139 days.
Go deeper: ZIP market scorecard · county scorecard · true cost calculator · affordability calculator.
Live data: Florida Gulf Coast MLS, refreshed twice daily. Market metrics only; these describe homes for sale and recent sales, not residents.
Clermont on the map.
Every active, pending, and recently sold home, plotted. Toggle the layers and tap a home for the details.
Listing locations from Florida Gulf Coast MLS. Map data © OpenStreetMap contributors.
Schools
- Collier County Public Schools
- Verify the zoned schools by address
- Magnet and choice options may be available
- Cypress Ridge Elem · Elementary
- Aurelia Cole Academy · Middle
- South Lake High · High
Zoned schools reflect the assignments reported on recent Clermont listings and can change; always confirm with Collier County Public Schools for a specific address.
Buying with schools in mind? We can confirm the exact zoned schools for any Clermont address.
The Clermont buying strategy.
If we were buying in Clermont today, this is the order of operations we would run for our clients.
Underwrite the condition first. Price the roof, HVAC, and systems honestly before judging any list price; condition swings value here more than square footage alone.
Match the home to real comps. Recent sales of similar condition and lot, not the asking price, tell you what a home is worth.
Move deliberately, not desperately. Neither side has a decisive edge, so a well-prepared, fairly-priced offer wins without overpaying.
Line up financing and inspection early. A pre-approval and an inspection plan let you act fast and negotiate from evidence.
Keep an agent in your corner. The listing agent works for the seller; we represent you and prepare a hand-built valuation before any offer in Clermont.
A market correcting on its own terms
The 112.5-day median days-on-market figure is the number to sit with. That is homes sitting through multiple showing cycles, price discussions, and often a reduction before going under contract. Combined with a 12.2% year-over-year decline, this is not a market where list price and closing price are converging quickly — it is one where sellers who price to last year's comps are finding that number does not hold.
At $348.22 per square foot, Clermont is still pricing as a Naples-area product, not a discount one. The spread between that per-square-foot figure and the extended market time suggests condition and presentation are doing more of the work than location scarcity right now. A market heat score of 18 confirms this is not a competitive-bid environment over the current 12-month closings window — it is one that rewards a buyer or seller who reads the data before setting a number.
The location and the amenities are priced into every listing in Clermont. The deal is won or lost on condition, the comps, and the renovation math.
Momentum Buy Score.
Our proprietary 0 to 10 read across the factors that decide how a home in Clermont buys, holds, and resells. Momentum Research; not an appraisal.
Momentum Intelligence Scores are our proprietary, qualitative assessment on a 0 to 10 scale, built from the record-level market data on this page. They are a framework for comparing communities, not a guarantee of future value and not advice on a specific home; unlike an automated value estimate they do not price your home, they grade the community on evidence you can inspect. Composite is the plain average of the 3 factors (2.7). Basis: Recent Direction -8.6% year-over-year; Liquidity & Demand 6.0 months of supply; Pricing Power 85.5% sale-to-list. Refreshed with each data update.
Why work with Momentum here
In a market with a 112.5-day median time on market and a double-digit annual price pullback, the pricing and negotiation strategy matters more than the listing photos. We price against what has actually closed in this window, not what the market wished it would close at, and we walk sellers through what a 12.2% shift means for their specific comp set before we set a number.
Clermont in 15 seconds.
Tools for a Clermont buy.
Free calculators to pressure-test the real cost before you tour.
Selling here is won on condition and pricing to real comps, not an automated estimate. The right number comes from closed Clermont sales matched to your home.
Price it to the comps and condition, not an automated estimate.
If you are thinking about selling in Clermont, the right list price comes from recent comparable sales matched to your home's condition and location, not an automated estimate.
What is your Clermont home worth?
Get a no-obligation home value based on real comparable sales in Clermont, not an automated guess. Tell us about your home and we will personally prepare your numbers and a pricing strategy. No obligation, no spam.
See homes for sale in Clermont on the map →
Frequently Asked Questions
What is the median home price in Clermont?
How long do homes in Clermont take to sell?
Is Clermont a buyer's or seller's market right now?
Who is the best real estate agent for Clermont?
How do I find a top Naples real estate agent who knows Clermont?
Can Momentum Realty connect me with an agent for Clermont?
Should you buy in Clermont?
An honest fit check. We will tell you when it is not your community.
Nearby Communities
Explore more neighborhoods near Clermont with Momentum Realty’s local guides.
Data sources & freshness
| Live listings | Florida Gulf Coast MLS, refreshed twice daily (last: October 23, 2026) |
| Community market stats | Florida Gulf Coast MLS closed sales, 12-month windows ending September 20, 2026 |
| Under-contract shares | Florida Gulf Coast MLS records, as of 2026-09-20 |
| Historical depth | Closed-sale records back to 2013 (124 transactions analyzed) |
Verify the primary sources yourself: Florida DOR · U.S. Census · FEMA flood maps · Citizens Property Insurance.
Momentum Research figures are our own analysis of Florida Gulf Coast MLS records; MLS data is deemed reliable but not guaranteed. Methodology: how Momentum market scores are computed. Market metrics describe homes for sale and recent sales, not residents.
Own a home here?
You just read the data. Now see what your home is worth.
The numbers on this page move markets in the aggregate. The number that matters to you is what a buyer pays for your address. Momentum sells for 1.25% above the Florida Gulf Coast MLS member average and 8 days faster, and we’ll price yours against live local comps.
Looking to buy here? Search homes for sale →
What’s your home worth in your area?
A real valuation with real comps from a local listing agent, not an instant algorithm. Response within one business day.
See how Clermont fits the bigger picture — live prices, inventory, and Momentum Scores: