
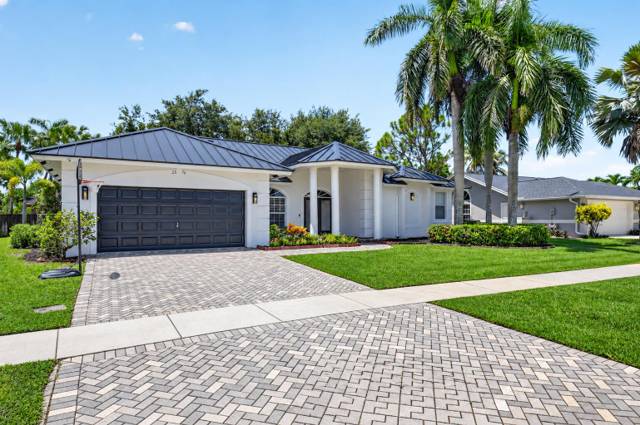
Greenview Shores 2 of Wellington
Homes for Sale in Wellington, FL
All 453 homes for sale in Wellington, FL · median $925,000 · 361 homes for sale in 33414 · Palm Beach County homes for sale
True comps, carrying-cost math, and listings before the portals.
Market Heat
Photo via Beaches MLS
As of October 2026, Greenview Shores 2 of Wellington in Wellington, FL has 5 homes for sale and 5 pending, asking from $704,999 to $969,900 (median $849,000). Over the 12 months ending 2026-08-10, 28 recorded sales closed at a median of $747,500, $309 per square foot, a median 23 days on market, sellers accepting 96% of original asking (+3% versus the prior year). Homes listed or recently sold were built 1985–2000; 10 listings state no HOA; none of the 21 geocoded homes sit in a FEMA special flood hazard zone (median elevation 17 ft). At the median price and Palm Beach County's FY2025-26 rate of 18.72 mills, annual property tax runs about $13,990 ($13,220 with the full homestead exemption).
Last 30 days in Greenview Shores 2 of Wellington: 2 new listings (median asking $822,000), 5 under contract right now, 4 closed sales (median $762,500). As of October 15, 2026, All listings featuring the BMLS logo are provided by BeachesMLS, Inc. This information is not verified for authenticity or accuracy and is not guaranteed. Copyright © 2026 BeachesMLS, Inc.
Homes For Sale Right Now in Greenview Shores 2 of Wellington
Live MLS inventory for Greenview Shores 2 of Wellington. Every active listing, what is under contract right now, and the last 12 months of closed sales, refreshed twice a day. Closed comps beat an algorithm's guess every time.
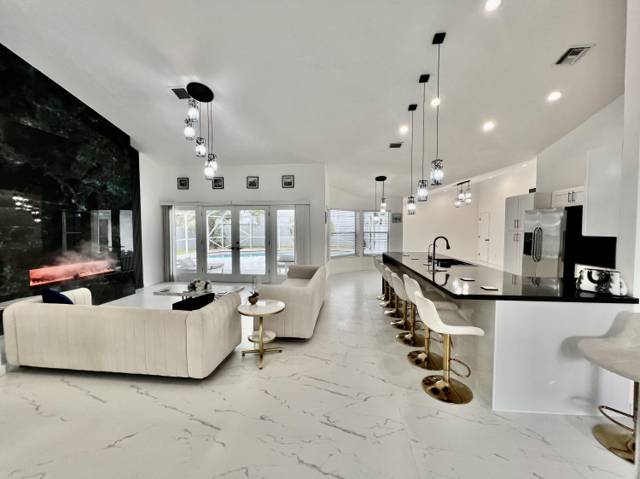 Active · 53 daysTop listing
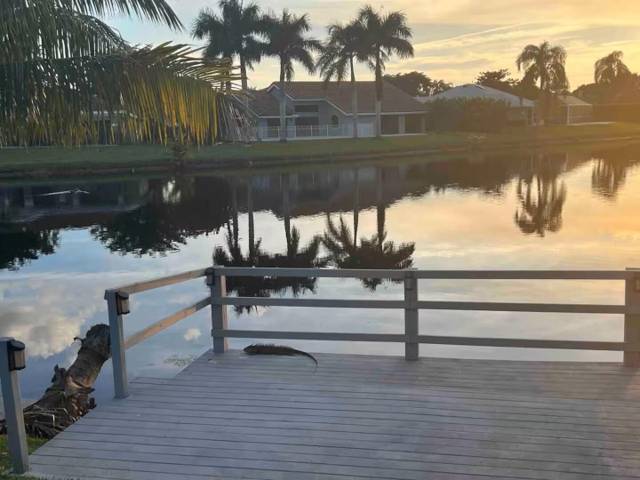 Active · 98 daysActive · 3 days
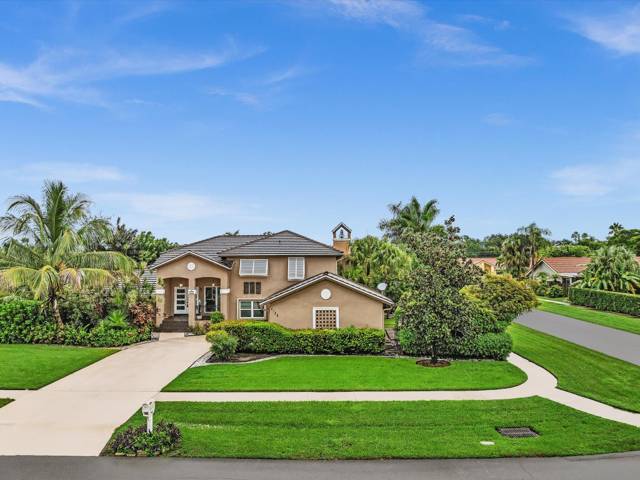 Active · 23 days
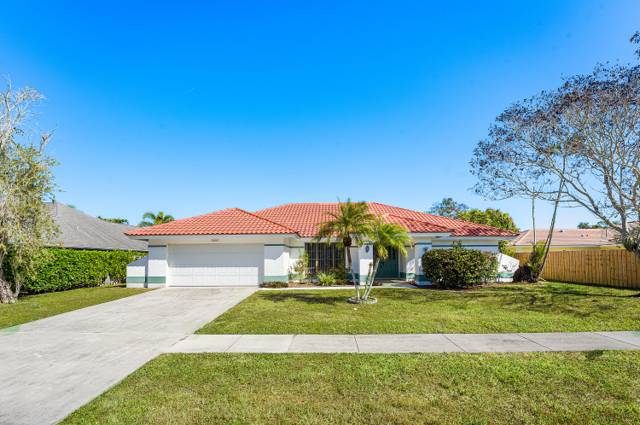 Active · 267 days
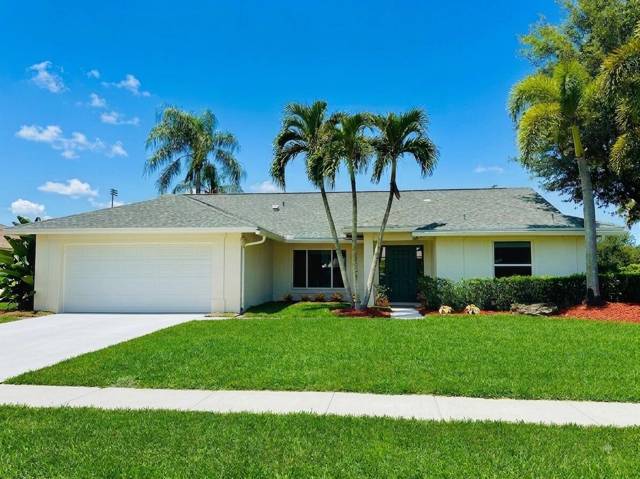 Pending · 26 days
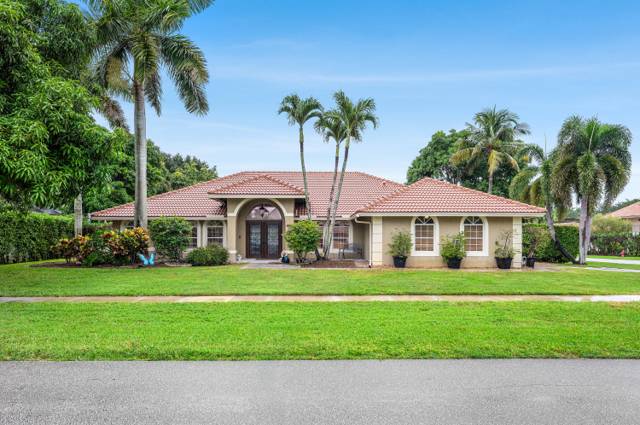 Pending · 7 days
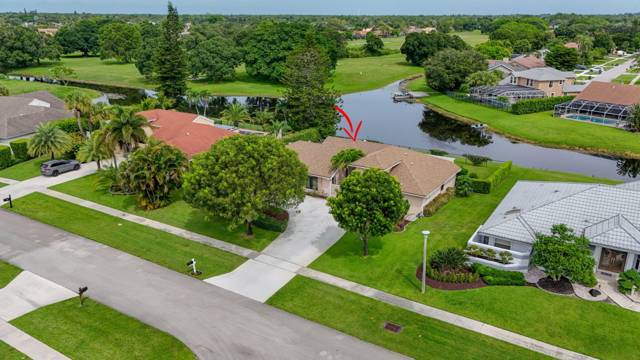 Pending · 32 days
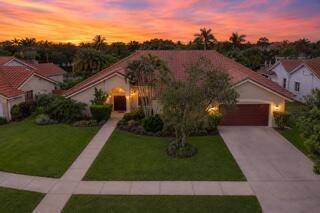 Pending · 28 days
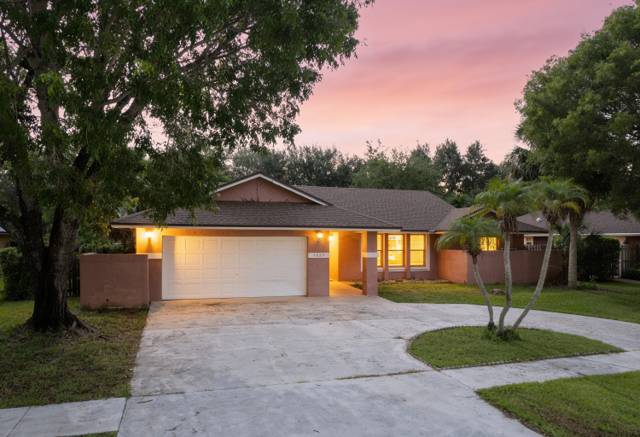 Pending · 7 days
Active and pending Greenview Shores 2 of Wellington listings as of 2026-10-15, priced high to low. All listings featuring the BMLS logo are provided by BeachesMLS, Inc. This information is not verified for authenticity or accuracy and is not guaranteed. Copyright © 2026 BeachesMLS, Inc. Tap any home to ask about it.
Greenview Shores 2 of Wellington right now
🟡 Balanced market. 3.0 months of supply and 12% of the inventory already under contract put buyers and sellers on roughly even footing.Why it matters: months of supply is how long today's inventory would last at today's sales pace; under-contract share is the portion of homes for sale that already have a buyer.Momentum Research analysis of Beaches MLS records, as of August 10, 2026. Confidence: Very High (8 active and pending listings, 28 closed sales in 12 months).
🟡 Still climbing. The trailing-12-month median ($748K) is up 3.1% from the prior 12 months ($725K).Momentum Research, record-level Beaches MLS closed sales, 12-month windows ending August 10. Confidence: High (28 and 21 sales in the two windows).
Jump to: Price history & scorecard · Homes for sale · Schools · FAQ
· Updated October 15, 2026 · Live data: Beaches MLS, refreshed twice daily · MLS facts carry their source; interpretation lines are Momentum Research · Data sources & freshness
The 60-Second Overview
Greenview Shores 2 of Wellington market snapshot (as of August 10, 2026): the median sale price is about $748K ($309 per sq ft over the trailing 12 months of closed sales), a median 23 days on market for closed sales, and 3.0 months of supply, a balanced market. The trailing-12-month median is up 3% from the prior 12 months, computed from record-level Beaches MLS closed sales (28 closings in the current window).
In ZIP 33414 (Wellington), 895 homes closed in the last 12 months at a median of $670K ($309/sq ft), up 1.6% year over year, with a median 50 days on market. Right now 142 active and 34 pending listings put supply at about 5.2 months — a balanced market. See the live ZIP 33414 housing market and the Palm Beach County market.
Flood zones in Greenview Shores 2 of: of 18 listing addresses checked against the FEMA National Flood Hazard Layer, 100% sit outside the FEMA Special Flood Hazard Area (Zone X). Individual parcels vary - verify any specific address at msc.fema.gov. See flood zones by neighborhood in Wellington.
Greenview Shores 2 of Wellington is a community of 294 homes in Wellington, Palm Beach County, built between 1984 and 2014 (median 1988.0), with a median living area of about 2,371 square feet. 78% of parcels are homesteaded, the owner-occupancy proxy in the Florida DOR assessment roll (2025 roll, public records).
The setting & the homes.
Aerial and on-site photos of Greenview Shores 2 of Wellington. Swipe to explore the community.
Swipe or use the arrows → tap any photo to enlarge
Greenview Shores 2 of WellingtonGreenview Shores 2 of WellingtonGreenview Shores 2 of WellingtonGreenview Shores 2 of WellingtonGreenview Shores 2 of WellingtonGreenview Shores 2 of WellingtonGreenview Shores 2 of WellingtonGreenview Shores 2 of WellingtonPhotos from Beaches MLS listings in Greenview Shores 2 of Wellington; content deemed reliable but not guaranteed.
Price History: What Homes Here Have Actually Sold For
Median sale price over the trailing 12 months ending August 10 of each year, from record-level Beaches MLS closed sales. Same methodology as every appreciation figure on this page: the 2026 point ($748K) IS the median in the snapshot above, and the move from 2025 ($725K) IS the +3.1% one-year change.
Windows contain 1 to 52 sales each (28 in the current window); every figure carries its sample size, and thin markets swing on single closings. All listings featuring the BMLS logo are provided by BeachesMLS, Inc. This information is not verified for authenticity or accuracy and is not guaranteed. Copyright © 2026 BeachesMLS, Inc. Deemed reliable but not guaranteed.
50% of homes for sale in Greenview Shores 2 of Wellington are already under contract (under contract ÷ under contract + active listings) — a read on how much of the available inventory buyers have already claimed. Source: MLS data (2026-10-15).
Greenview Shores Market Scorecard
Greenview Shores is currently a seller's market. About 2.1 months of supply, a median asking price of $849,000, and homes go under contract in about 53 days.
Typical home value in the 33414 ZIP is $624,058, about 18.7% above the Florida norm (Zillow Home Value Index).
Go deeper: ZIP market scorecard · county scorecard · true cost calculator · affordability calculator.
Live data: BeachesMLS, refreshed twice daily. Typical value: Zillow Research. Market metrics only; these describe homes for sale and recent sales, not residents.
Greenview Shores 2 of Wellington on the map.
Every active, pending, and recently sold home, plotted. Toggle the layers and tap a home for the details.
Listing locations from Beaches MLS. Map data © OpenStreetMap contributors.
Life at Greenview Shores 2 of Wellington
- Park · reported on 2 of 21 listings
- Security Lights · reported on 1 of 21 listings
- Playground · reported on 1 of 21 listings
- Jogging Path · reported on 1 of 21 listings
Community amenities as reported across Beaches MLS listings in this community; deemed reliable but not guaranteed. Verify current amenities and access with the HOA.
Schools
- Palm Beach County Public Schools
- Verify the zoned schools by address
- Magnet and choice options may be available
- New Horizons · Elementary
- Polo Park · Middle
- Wellington · High
Zoned schools reflect the assignments reported on recent Greenview Shores 2 of Wellington listings and can change; always confirm with Palm Beach County Public Schools for a specific address.
Buying with schools in mind? We can confirm the exact zoned schools for any Greenview Shores 2 of Wellington address.
Shop the zone: Homes zoned for Wellington High School
Recent Developments in Greenview Shores 2 Of Wellington
Development, infrastructure, retail, and school activity affecting Greenview Shores 2 Of Wellington, tracked by our team and summarized from public reporting and official sources, with links to the original coverage. Last updated October 2026.
- September 2026Development
Palm Beach County approves $26M deal for 400-room second convention center hotel
Palm Beach County commissioners voted 6-1 to approve a $26 million deal with Related Ross for a 400-room hotel on land adjacent to the county convention center in downtown West Palm Beach. The county would buy the property and lease it back to the developer, and officials estimate about 650 permanent jobs, including roughly 255 hotel jobs. Construction could finish within three years.
What it may mean for the marketAdds hotel capacity and several hundred permanent jobs next to the downtown convention district, supporting nearby dining and retail demand. The project is about 13 miles east of Greenview Shores 2 Of Wellington, elsewhere in Palm Beach County.
Source: WPTV - September 2026Infrastructure
Palm Beach County approves one-year moratorium on large data centers in unincorporated areas
County commissioners unanimously approved the pause on September 24 after a first reading on August 27. It covers new applications for facilities expected to draw 50 megawatts or more at peak demand, with related parcels counted together. The pause lasts one year or until permanent rules are adopted.
What it may mean for the marketPauses large power-intensive facilities in unincorporated areas while permanent rules are written, which affects industrial land use and grid demand planning. The site is about 14 miles east of Greenview Shores 2 Of Wellington.
Source: Find Cheap Broadband - September 2026Parks & Amenities
$280M Palm Beach County parks bond on November ballot would fund fieldhouse, new parks and upgrades
The $280 million bond on the November 3 ballot would be repaid at 5 cents per $1,000 of taxable value over 20 years. Projects include a multisport fieldhouse at Okeeheelee Park, a 125-acre off-highway-vehicle complex near 20-Mile Bend, a 136-acre Sansbury Way Park and a 90-acre Lantana District I Park. The project list may change.
What it may mean for the marketIf approved, the bond would add and upgrade county recreation amenities, including indoor sports space near Okeeheelee Park. The site is about 7 miles east of Greenview Shores 2 Of Wellington.
Source: Stet News - September 2026Civic
Palm Beach County puts $175M library bond on November 3 ballot to replace Main Library
Voters will decide on November 3 whether to authorize a $175 million library bond. It would fund a roughly $150 million, 150,000-square-foot replacement for the 1972 Main Library on Summit Boulevard, renovations at 18 branches and completion of a 19th branch in Hypoluxo. The bond needs a simple majority.
What it may mean for the marketIf approved, the bond would upgrade public library facilities across the county's library taxing district and add a branch in Hypoluxo. The site is about 10 miles east of Greenview Shores 2 Of Wellington.
Source: Hoodline - July 2026Market
Palm Beach County Total Home Sales Jump for 10th Consecutive Month
Palm Beach County total home sales rose 22.3% year-over-year in June 2026 to 2,456 transactions, with total dollar volume up 53.90% to $2.7 billion. The single-family median sale price increased to $700,000 and the condominium median rose to $325,000.
What it may mean for the marketRising sales volume and median prices signal strengthening demand and higher valuations across the Palm Beach County housing market. The site is about 13 miles east of Greenview Shores 2 Of Wellington.
Source: MIAMI REALTORS - July 2026Development
The Berkeley Palm Beach Breaks Ground at 550 South Australian Avenue in West Palm Beach
The Berkeley Palm Beach broke ground on a 25-story tower with 193 condominium residences at 550 South Australian Avenue overlooking Clear Lake, developed by Al Adelson with Arquitectonica as designer. Sales have exceeded $120 million and completion is anticipated in 2029.
What it may mean for the marketA new 25-story condominium tower adds high-end for-sale housing supply to the downtown West Palm Beach market and continues vertical development along the Clear Lake waterfront. The project is about 13 miles east of Greenview Shores 2 Of Wellington, elsewhere in Palm Beach County.
Source: Florida YIMBY
Summaries reflect public reporting and official sources linked above as of the dates shown. Project details, timelines, and approvals can change. Commentary on potential market effects is general observation, not investment advice or a prediction for any specific property. For the freshest items across the whole region, see This Week in Northeast Florida.
The Greenview Shores 2 of Wellington buying strategy.
If we were buying in Greenview Shores 2 of Wellington today, this is the order of operations we would run for our clients.
Underwrite the condition first. Price the roof, HVAC, and systems honestly before judging any list price; condition swings value here more than square footage alone.
Match the home to real comps. Recent sales of similar condition and lot, not the asking price, tell you what a home is worth.
Move deliberately, not desperately. Neither side has a decisive edge, so a well-prepared, fairly-priced offer wins without overpaying.
Line up financing and inspection early. A pre-approval and an inspection plan let you act fast and negotiate from evidence.
Keep an agent in your corner. The listing agent works for the seller; we represent you and prepare a hand-built valuation before any offer in Greenview Shores 2 of Wellington.
A closer look at the Greenview Shores 2 of Wellington market
At a median of $309 per square foot, Greenview Shores 2 of Wellington prices sit in a fairly defined band, so condition and updates — more than the list price — tend to separate one home from the next.
Inventory runs at 3.0 months of supply, a balanced market and the trailing-12-month median up 3% year over year. Homes that do trade take a median 23 days on market, useful leverage on any listing that has lingered.
The housing stock is 294 homes built between 1984 and 2014, and 78% of parcels are homesteaded — the owner-occupancy proxy in the Florida DOR assessment roll.
The location and the amenities are priced into every listing in Greenview Shores 2 of Wellington. The deal is won or lost on condition, the comps, and the renovation math.
Momentum Buy Score.
Our proprietary 0 to 10 read across the factors that decide how a home in Greenview Shores 2 of Wellington buys, holds, and resells. Momentum Research; not an appraisal.
Momentum Intelligence Scores are our proprietary, qualitative assessment on a 0 to 10 scale, built from the record-level market data on this page. They are a framework for comparing communities, not a guarantee of future value and not advice on a specific home; unlike an automated value estimate they do not price your home, they grade the community on evidence you can inspect. Composite is the plain average of the 4 factors (7.2). Basis: Recent Direction +3.1% year-over-year; Liquidity & Demand 3.0 months of supply; Owner Commitment 78% owner-occupied; Pricing Power 96.0% sale-to-list. Refreshed with each data update.
What it really costs to own in Greenview Shores 2 of Wellington
The parts of the monthly number a mortgage calculator leaves out, from the tax roll, the MLS, Citizens and FEMA. Property facts only.
| Property tax | Current owners' bills run a median of $7,135/yr across 22 listings here (MLS tax records, 2026-10-15). |
|---|---|
| Home and flood insurance | The average Citizens Property Insurance premium in Palm Beach County is $1,753/yr (18,387 policies, Citizens detail by county, April 2026); private-market quotes depend on roof age, wind mitigation and construction. Flood: of 18 listing addresses checked against the FEMA flood map, 100% sit outside the high-risk zone. Statewide, a Zone X flood policy runs about $500-$700/yr and a high-risk zone $1,200-$2,500/yr (FEMA Risk Rating 2.0 averages, not quotes). |
| Roof and age | Median build year 1988 across 22 listings. An original roof here would be about 38 years old; under Florida's 2022 reform (SB 2-D) carriers may require an inspection past 15 years, so budget for a roof report, and for replacement where it fails. |
Email me new listings in Greenview Shores 2 of Wellington
One e-mail a day, only when a home lists here, with price, beds, baths and a link to every listing. Straight from the MLS feed; no account needed.
Ask an agent about Greenview Shores 2 of Wellington
Have a question about the homes, fees, rules or commute here? A Momentum agent who works Greenview Shores 2 of Wellington will answer, and the answer is published on this page for the next buyer.
HOA, CDD & Fees
- HOA status not on record. Verify any dues before you offer
- Any club/amenity membership is billed separately
Confirm the current HOA dues, exactly what they cover, and any CDD bond or special assessment for a specific address before you offer.
Flood & Insurance Context
Of 18 sampled listing addresses in this community: 100% outside the FEMA Special Flood Hazard Area (Zone X/B/C).
Address-sampled; individual parcels vary - verify any specific address at msc.fema.gov. Check any address at FEMA's Flood Map Service Center, and see average home-insurance costs by Florida county.
Source: FEMA National Flood Hazard Layer, address-level lookups (n=18) · as of 2026-10
Tools for a Greenview Shores 2 of Wellington buy.
Free calculators to pressure-test the real cost before you tour.
Selling here is won on condition and pricing to real comps, not an automated estimate. The right number comes from closed Greenview Shores 2 of Wellington sales matched to your home.
Price it to the comps and condition, not an automated estimate.
If you are thinking about selling in Greenview Shores 2 of Wellington, the right list price comes from recent comparable sales matched to your home's condition and location, not an automated estimate.
What is your Greenview Shores 2 of Wellington home worth?
Get a no-obligation home value based on real comparable sales in Greenview Shores 2 of Wellington, not an automated guess. Tell us about your home and we will personally prepare your numbers and a pricing strategy. No obligation, no spam.
See all homes for sale in Wellington →
Recently off market in GREENVIEW SHORES 2 OF WELLINGTON
Homes in GREENVIEW SHORES 2 OF WELLINGTON that recently left the market. Each address opens its public-record profile: county-recorded value, property taxes, the last recorded sale, community sales history, and what is for sale nearby now. 18 on record.
- 13546 Staimford Drive · off market
- 13578 Chatsworth Village Drive · off market
- 13763 Norwick Street · off market
- 1506 Wiltshire Village Drive · off market
- 1540 Farmington Court · off market
- 1558 Farmington Avenue · off market
- 1570 Farmington Avenue · off market
- 1593 Yarmouth Avenue · off market
| Location | Wellington, Palm Beach County, FL · ZIP 33414 |
|---|---|
| Homes in the community | 294 (FL DOR 2025 assessment roll) |
| Years built | 1984–2014 (median 1988.0) |
| Typical living area | 2,371 sq ft (median) |
| Home types (current listings and sales) | single-family 100% |
| Amenities listed by sellers | Fire Alarm, None, Security System, Carbon Monoxide Detector(s), Closed Circuit Camera(s), Fire Sprinkler System |
| Sale prices, last 12 months | $747,500 median across 28 closed sales · $309 per sq ft · +3.1% vs the prior 12 months |
| Days on market (closed sales) | 23 median |
| For sale right now | 7 active, 1 pending · median asking $780,000 · 3.0 months of supply |
| Owner-occupied (homestead) share | 78% |
Data as of August 10, 2026. All listings featuring the BMLS logo are provided by BeachesMLS, Inc. This information is not verified for authenticity or accuracy and is not guaranteed. Copyright © 2026 BeachesMLS, Inc; housing-stock figures from Florida Department of Revenue public records. Market figures describe homes, not residents. Cite as: Momentum Realty, “Greenview Shores 2 of Wellington key facts,” movewithmomentum.com/neighborhoods/greenview-shores-2-of-wellington-wellington, data as of August 10, 2026.
Housing distress & ownership in GREENVIEW SHORES 2 OF WELLINGTON, Wellington
Who owns here, how much is not owner-occupied, and how much for-sale inventory is under distress.
Source: Momentum Realty Research. Ownership & parcels from the FL DOR 2025 tax roll; distress from MLS active-listing status/remarks; price from MLS closed sales. All listings featuring the BMLS logo are provided by BeachesMLS, Inc. This information is not verified for authenticity or accuracy and is not guaranteed. Copyright © 2026 BeachesMLS, Inc. Deemed reliable but not guaranteed.
Just listed in Greenview Shores 2 of Wellington
The newest homes for sale in Greenview Shores 2 of Wellington right now, newest first. Each link opens the full listing with every photo, the price history and a tour request.
- 2676 Yarmouth Drive $849,000 · 4 bd · 3 ba · 2,571 sq ft · 3 days on market Courtesy of Floridas Property Management
- 2158 Portland Avenue $795,000 · 3 bd · 3 ba · 2,403 sq ft · 23 days on market Courtesy of Lamacchia Realty, Inc.
- 13646 Brightstone Street $969,900 · 5 bd · 4 ba · 2,800 sq ft · 53 days on market Courtesy of Partnership Realty Inc.
- 2060 Amesbury Circle $929,999 · 4 bd · 2 ba · 2,265 sq ft · 98 days on market Courtesy of RE Florida Homes
- 2057 Amesbury Circle $704,999 · 3 bd · 2 ba · 2,082 sq ft · 267 days on market Courtesy of LPT Realty, LLC
Checked against the MLS Oct 15, 2026. All new listings in this market.
Every Home for Sale in Greenview Shores 2 Of Wellington Wellington Right Now (10)
All 10 active and pending Greenview Shores 2 Of Wellington Wellington listings with a detail page, newest first, refreshed twice a day from the MLS.
- 2676 Yarmouth Drive · $849,000 · 4 bd / 3 ba · listed Oct 11, 2026 · listed by Floridas Property Management
- 12685 Buckland Street · $725,000 · 4 bd / 2 ba · pending · listed Oct 2, 2026 · listed by RE/MAX Direct
- 2158 Portland Avenue · $795,000 · 3 bd / 3 ba · listed Sep 22, 2026 · listed by Lamacchia Realty, Inc.
- 2652 Yarmouth Drive · $499,500 · 5 bd / 2 ba · pending · listed Sep 9, 2026 · listed by Mastropieri Group LLC
- 2156 Amesbury Circle · $649,000 · 3 bd / 2 ba · pending · listed Sep 4, 2026 · listed by Keller Williams Realty - Wellington
- 13646 Brightstone Street · $969,900 · 5 bd / 4 ba · listed Aug 23, 2026 · listed by Partnership Realty Inc.
- 13708 Folkestone Circle · $729,000 · 4 bd / 2 ba · pending · listed Aug 15, 2026 · listed by United Realty Group, Inc
- 1848 Lynton Circle · $720,000 · 3 bd / 2 ba · pending · listed Aug 9, 2026 · listed by Coldwell Banker Realty
- 2060 Amesbury Circle · $929,999 · 4 bd / 2 ba · listed Jul 16, 2026 · listed by RE Florida Homes
- 2057 Amesbury Circle · $704,999 · 3 bd / 2 ba · listed Jul 16, 2026 · listed by LPT Realty, LLC
Recently sold in Greenview Shores 2 Of Wellington Wellington
- 1860 Lynton Circle · sold $875,000
- 13578 Chatsworth Village Drive · sold $725,000
- 1506 Wiltshire Village Drive · sold $722,500
- 2063 Amesbury Circle · sold $800,000
- 1945 Lynton Circle · sold $755,000
- 13763 Norwick Street · sold $665,000
- 2171 Amesbury Circle · sold $600,000
- 1593 Yarmouth Avenue · sold $930,000
- 2195 Portland Court · sold $899,000
- 1738 Lindsey Court · sold $920,000
Closed sales from the MLS; each page shows the sold price, taxes and value history.
More Wellington home searches
- All homes for sale in Wellington, FL
- Homes for sale in Palm Beach County, FL
- Wellington pool homes for sale
- Wellington waterfront homes for sale
- Gated communities in Wellington
- Wellington golf course homes
- Homes under $300K in Wellington
- Homes from $300K to $500K in Wellington
- 4-bedroom homes for sale in Wellington
- Wellington home values: what is my house worth?
Streets in this community
Street-level pages: every home on record, what sold and what is for sale on each street.
- Wiltshire Village Drive (23 homes on record)
- Staimford Drive (19 homes on record)
- Yarmouth Drive (16 homes on record)
- Lynton Circle (15 homes on record)
- Grantham Drive (9 homes on record)
- Grantham Drive (1 homes on record)
Frequently Asked Questions
What is the median home price in Greenview Shores 2 of Wellington?
How long do homes in Greenview Shores 2 of Wellington take to sell?
Is Greenview Shores 2 of Wellington a buyer's or seller's market right now?
How many homes are in Greenview Shores 2 of Wellington?
What share of Greenview Shores 2 of Wellington is owner-occupied?
When were the homes in Greenview Shores 2 of Wellington built?
Who is the best real estate agent for Greenview Shores 2 of Wellington?
How do I find a top Wellington real estate agent who knows Greenview Shores 2 of Wellington?
Can Momentum Realty connect me with an agent for Greenview Shores 2 of Wellington?
Where is Greenview Shores 2 of Wellington, and what county is it in?
Is Greenview Shores 2 of Wellington in a flood zone?
Is Greenview Shores 2 of Wellington a good place to live?
Data sources & freshness
| Live listings | Beaches MLS, refreshed twice daily (last: October 15, 2026) |
| Community market stats | Beaches MLS closed sales, 12-month windows ending August 10, 2026 |
| Housing stock & ownership | Florida DOR assessment roll (street-list match (5 streets, ZIP 33414)) |
| Under-contract shares | Beaches MLS records, as of 2026-08-10 |
| Historical depth | Closed-sale records back to 2013 (369 transactions analyzed) |
Verify the primary sources yourself: Florida DOR · U.S. Census · FEMA flood maps · Citizens Property Insurance.
Momentum Research figures are our own analysis of Beaches MLS records; MLS data is deemed reliable but not guaranteed. Methodology: how Momentum market scores are computed. Market metrics describe homes for sale and recent sales, not residents.
Own a home here?
You just read the data. Now see what your home is worth.
The numbers on this page move markets in the aggregate. The number that matters to you is what a buyer pays for your address. Momentum sells for 1.25% above the Beaches MLS member average and 8 days faster, and we’ll price yours against live local comps.
Looking to buy here? Search homes for sale →
What’s your home worth in your area?
A real valuation with real comps from a local listing agent, not an instant algorithm. Response within one business day.
See how GREENVIEW SHORES 2 OF WELLINGTON fits the bigger picture — live prices, inventory, and Momentum Scores:
Nearby Communities
Explore more neighborhoods near Greenview Shores 2 of Wellington with Momentum Realty’s local guides.
More on Greenview Shores 2 of Wellington
- Home values · What homes in Greenview Shores 2 of Wellington actually sell for