
Townhomes for Sale in Fernandina Beach, FL
9 townhomes are for sale in Fernandina Beach, FL as of 2026-10-15. The median list price is $685,900 ($400/sq ft), most townhomes list between $440K to $1.30M, and the median listing has been on the market 138 days. 0 townhomes came on the market this week and 261 sold in the last 12 months at a median of $470,000.
Newest townhomes for sale in Fernandina Beach
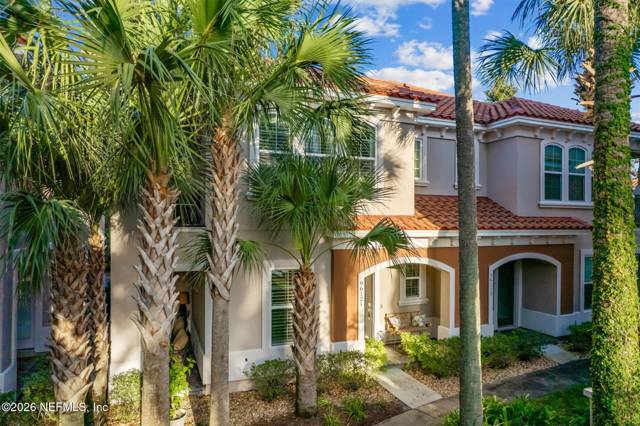
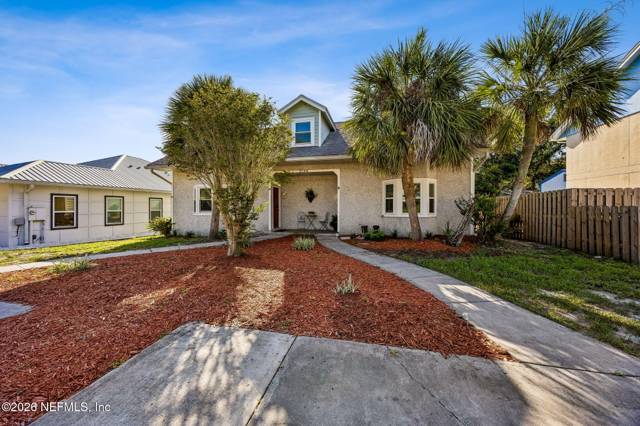
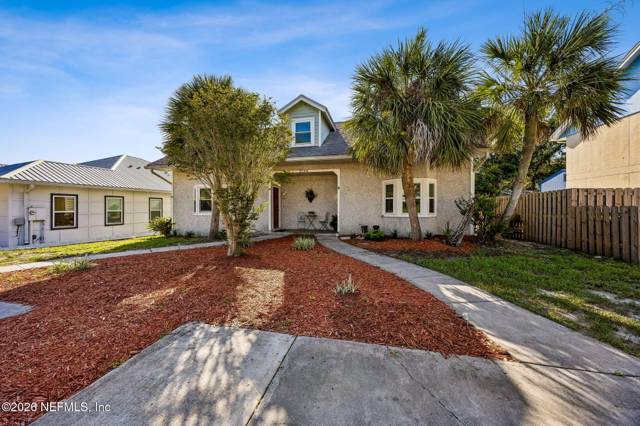
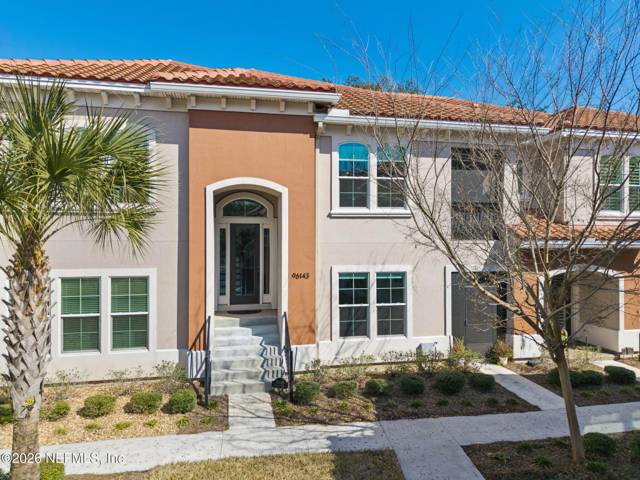
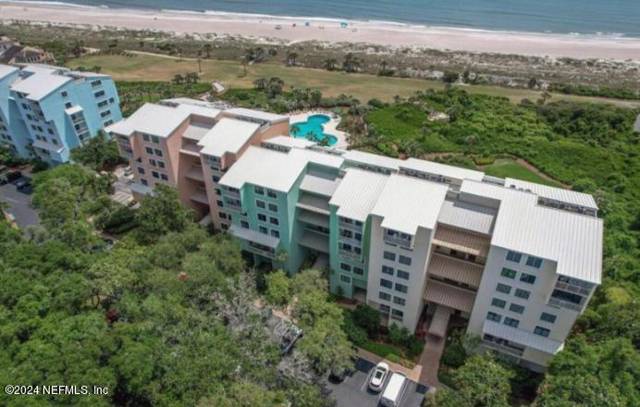
The most recently listed homes in Fernandina Beach, newest first, with photos. Each card opens the full listing with every photo, the community’s sales history and a tour request. Homes marked New listed in the last seven days.
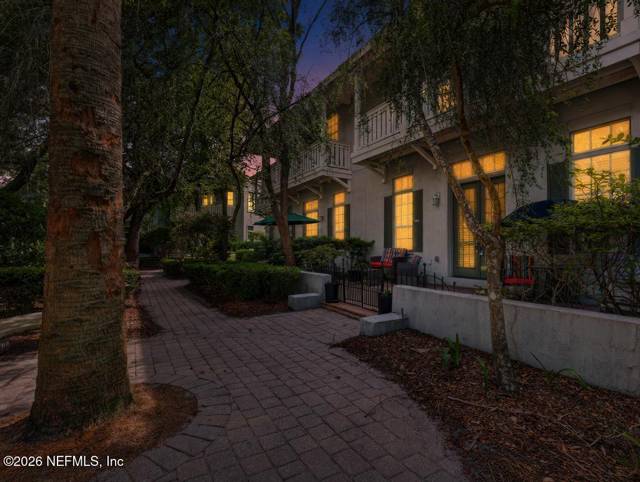
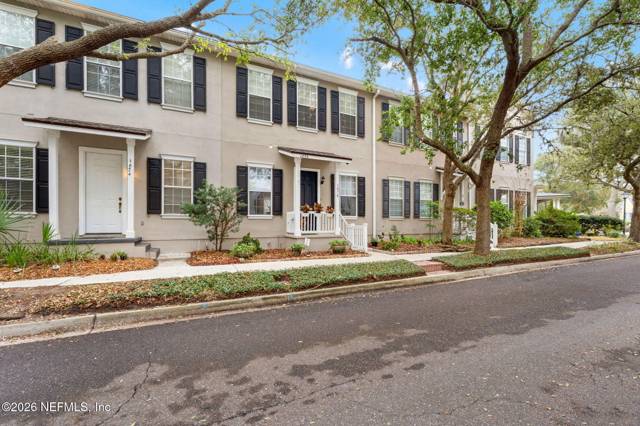
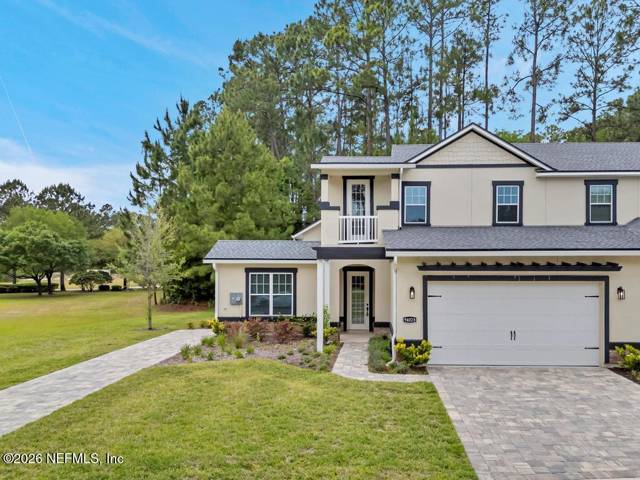
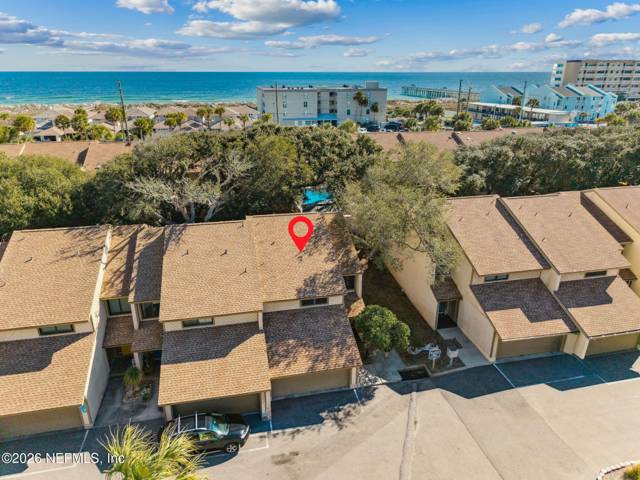
Fernandina Beach townhomes for sale by price
Every active listing in Fernandina Beach grouped by price, with the newest listings in each band. The median is $685,900; the busiest band is $500K – $750K.
$400K – $500K: 1 home
$500K – $750K: 4 homes
- $625,000 · 3 bd / 2.5 ba / 1,998 sq ft · 1524 RUSKIN Lane (Amelia Park)
- $678,500 · 3 bd / 2.5 ba / 1,628 sq ft · 1878 CARNATION Street (Crane Island)
- $685,900 · 3 bd / 3.5 ba / 2,535 sq ft · 94028 HEMLOCK Court (Amelia National)
- $595,000 · 3 bd / 2.5 ba / 1,362 sq ft · 3165 1ST Avenue #15 (Sea Castles)
$750K – $1M: 3 homes
- $799,000 · 3 bd / 2.5 ba / 2,000 sq ft · 96121 HANGING MOSS Drive (Summer Beach)
- $850,000 · 3 bd / 1.5 ba / 1,250 sq ft · 2734 OCEAN Drive (Oceanside)
- $785,000 · 3 bd / 2.5 ba / 2,064 sq ft · 96143 HANGING MOSS Drive (Summer Beach)
$1M and up: 1 home
Every home for sale in Fernandina Beach right now (9)
All 9 active Fernandina Beach listings with a detail page, newest first, refreshed twice a day from the MLS.
- $799,000 · 3 bd / 2.5 ba / 2,000 sq ft · 96121 HANGING MOSS Drive (Summer Beach)
- $850,000 · 3 bd / 1.5 ba / 1,250 sq ft · 2734 OCEAN Drive (Oceanside)
- $440,000 · 3 bd / 1.5 ba / 1,252 sq ft · 2734B OCEAN Drive (Oceanside)
- $785,000 · 3 bd / 2.5 ba / 2,064 sq ft · 96143 HANGING MOSS Drive (Summer Beach)
- $625,000 · 3 bd / 2.5 ba / 1,998 sq ft · 1524 RUSKIN Lane (Amelia Park)
- $678,500 · 3 bd / 2.5 ba / 1,628 sq ft · 1878 CARNATION Street (Crane Island)
- $685,900 · 3 bd / 3.5 ba / 2,535 sq ft · 94028 HEMLOCK Court (Amelia National)
- $595,000 · 3 bd / 2.5 ba / 1,362 sq ft · 3165 1ST Avenue #15 (Sea Castles)
- $1.30M · 3 bd / 3.5 ba / 2,131 sq ft · 1302 SHIPWATCH Circle (Ship Watch)
Townhomes for sale in Fernandina Beach by ZIP code
Where the inventory is: active listings and the median asking price by ZIP. ZIPs link to their housing scorecard.
| ZIP | Townhomes for sale | Median list price |
|---|---|---|
| 32034 | 9 | $685,900 |
Fernandina Beach communities with the most townhomes for sale
The Fernandina Beach neighborhoods and subdivisions with active listings, the median asking price in each, and what homes there actually sold for over the last 12 months. Community names open the community guide with live inventory, sales history, HOA and schools.
| Community | For sale | Median list | Median sold (12 mo) | Days on market |
|---|---|---|---|---|
| Summer Beach | 2 | $792,000 | — | — |
| Amelia National | 1 | $685,900 | — | — |
| Amelia Park | 1 | $625,000 | — | — |
| Crane Island | 1 | $678,500 | — | — |
| Sea Castles | 1 | $595,000 | — | — |
| Ship Watch | 1 | $1.30M | — | — |
| Oceanside | 2 | $645,000 | — | — |
The Fernandina Beach real estate market right now
Over the last 12 months 261 homes sold in Fernandina Beach at a median of $470,000 (-1.7% year over year), $226 per square foot. Sellers received 95% of list price and homes took a median 48 days to go under contract. With 9 townhomes for sale against that sales pace, months of supply is 0.4, a seller’s market by the six-month rule. New construction was 14% of sales.
Fernandina Beach supply by price band
| Price band | Active | Sold, 12 mo | Months of supply | DOM |
|---|---|---|---|---|
| Under $300K | 9 | 22 | 4.9 | 48 |
| $300K–$500K | 17 | 55 | 3.7 | 55 |
| $500K–$750K | 33 | 97 | 4.1 | 65 |
| $750K+ | 38 | 87 | 5.2 | 57 |
Fernandina Beach home prices by year
Median sold price, closed sales, days on market and sale-to-list ratio by year, from Momentum’s MLS record.
| Year | Median sold price | Homes sold | Days on market | Sale-to-list |
|---|---|---|---|---|
| 2020 | $378,119 | 544 | 76 | 97% |
| 2021 | $464,366 | 647 | 34 | 99% |
| 2022 | $564,778 | 572 | 16 | 100% |
| 2023 | $598,108 | 466 | 41 | 97% |
| 2024 | $631,746 | 498 | 45 | 95% |
| 2025 | $621,339 | 468 | 49 | 96% |
| 2026 | $528,917 | 533 | 55 | 95% |
What a home in Fernandina Beach costs to own
Take the median $685,900 listing with 20% down at today’s 7.40% 30-year rate: principal and interest run about $3,799/month. Nassau County’s typical millage of 13.28 puts property tax near $8,442/year after the $50,000 homestead exemption — and that is the reset bill a buyer pays, not the seller’s capped one. Citizens’ average premium in Nassau County is about $1,159/year; newer roofs and inland addresses usually quote below it. All in, plan on roughly $4,599/month plus any HOA or CDD assessment.
Explore Fernandina Beach
- All townhomes for sale in Nassau County, FL
- Fernandina Beach real estate guide: communities with the most sales, price band, how to buy here
- What is my house worth in Fernandina Beach? Home values, $/sq ft and days to contract
- 4-bedroom townhomes for sale in Fernandina Beach
- Homes under $300K in Fernandina Beach
- Homes from $300K to $500K in Fernandina Beach
- Fernandina Beach pool townhomes for sale
- Fernandina Beach waterfront townhomes for sale
- Fernandina Beach golf course townhomes for sale
- Gated communities in Fernandina Beach
- Luxury townhomes for sale in Fernandina Beach
- Recently sold homes in Fernandina Beach: what buyers actually paid
- New listings this week in Fernandina Beach
- Price reductions this week in Fernandina Beach
- Fernandina Beach homes by street
- What $500K buys in Nassau County
- Fernandina Beach market intelligence: prices, supply and trends
- Fernandina Beach ZIP codes: every ZIP, map and home prices
- Moving to Fernandina Beach: the data guide
- Cost of living in Fernandina Beach
- New construction homes in Fernandina Beach
- Best neighborhoods in Fernandina Beach
- Nassau County property tax guide
- Nassau County down payment assistance limits
- First-time home buyer guide for Florida
- Search every Fernandina Beach community
- Best places to live in Florida: every city ranked by the numbers
- Best beach towns in Florida, ranked
- All Florida cities and counties
Townhomes for sale near Fernandina Beach
- Townhomes for sale in Yulee, FL — 199 listings
- Townhomes for sale in Hilliard, FL — 60 listings
- Townhomes for sale in Callahan, FL — 53 listings
- Townhomes for sale in Bryceville, FL — 11 listings
Recently off market in Fernandina Beach
Homes in Fernandina Beach that left the market most recently, with their last list price and a public-record page for each address. Off-market pages keep the community, tax and sales-history context after a listing closes or expires.
- 96328 Ridgewood Circle · last listed $368,000 · off market Oct 14, 2026
- 96048 Cottage Court · last listed $290,000 · off market Oct 14, 2026
- 101 S 8th Street · last listed $525,000 · off market Oct 14, 2026
- 95402 Woodbridge Parkway · last listed $475,000 · off market Oct 10, 2026
- 85645 Stonehurst Parkway · last listed $456,550 · off market Oct 9, 2026
- 2700 Mizell Avenue #504A · last listed $359,000 · off market Oct 9, 2026
- 1657 Sea Dunes Place · last listed $1,049,990 · off market Oct 9, 2026
- 96177 Long Beach Dr · off market Oct 8, 2026
- 95332 Village Dr · off market Oct 8, 2026
- 95318 Katherine St · off market Oct 8, 2026
- 95169 Catalina Dr · off market Oct 8, 2026
- 95096 Barclay Pl 2A · off market Oct 8, 2026
Common questions
How many townhomes are for sale in Fernandina Beach, FL?
What is the median home price in Fernandina Beach?
How long do homes take to sell in Fernandina Beach?
What does a $685,900 home in Fernandina Beach cost per month?
Which Fernandina Beach neighborhoods have the most townhomes for sale?
How do I see a home for sale in Fernandina Beach?
Where is Fernandina Beach, FL, and what county is it in?
What ZIP codes are in Fernandina Beach, FL?
How do I buy a house in Fernandina Beach, FL?
Listings, counts and prices are from Momentum Realty’s MLS record of active residential listings in Fernandina Beach as of 2026-10-15 and refresh as homes list and sell. Listings courtesy of Stellar MLS as distributed by MLS GRID. Source: Data provided by realMLS. The data relating to real estate for sale on this page comes in part from the Internet Data Exchange (IDX) program of the MLS(s) named above; listings held by brokerages other than Momentum Realty are marked with the listing brokerage’s name. Information is deemed reliable but not guaranteed. Estimates are not guarantees. Equal Housing Opportunity.