
Data Analysis
Duval County single-family houses listed under $300,000 went into a contract 192 times from October 21 to November 3, 2026, up 42 percent from 135 in the prior two weeks, while house contracts at $300,000 and up held flat.
Our live MLS feed logged 192 Duval house contracts under $300,000 in two weeks, up from 135. Contracts at $300,000 and up slipped from 216 to 210.
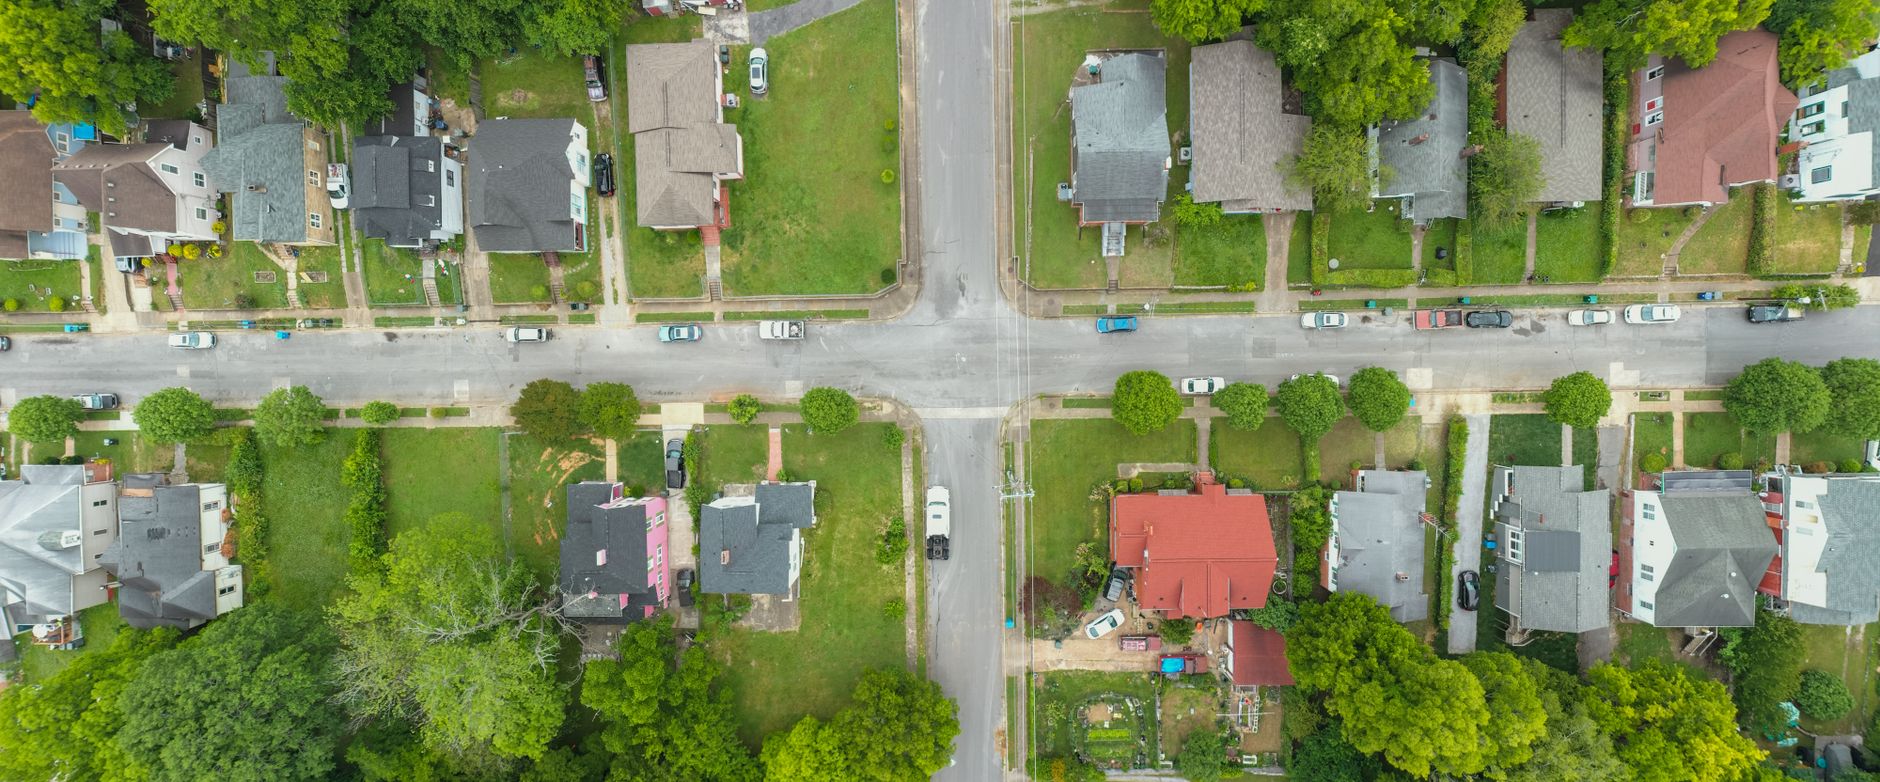
From October 21 through November 3, 2026, our live NEFAR MLS (realMLS) feed logged 192 Duval County single-family houses under $300,000 going into a contract, up 42 percent from 135 in the prior two weeks, October 7 to 20. House contracts at $300,000 and up slipped from 216 to 210. Price cuts on houses under $300,000 eased from 364 to 348, with a median cut of 2.0 percent, or $5,000. The median house that went into a contract under $300,000 was listed at $217,000. All figures are ours, computed from NEFAR MLS records; information is deemed reliable but not guaranteed.
This is a two-week read on the entry tier of the Duval house market. Our October 29 article on Duval condos under contract covered condos, and our November 2 article on Nassau County homes in Yulee and Fernandina Beach covered Nassau. Completed-month prices are in our Jacksonville median price article and on the Jacksonville market data hub.
Which price ranges drove the jump in contracts?
Every slice under $300,000 gained. Houses listed under $200,000 rose the most in count.
| List price at contract | Contracts Oct 21 to Nov 3 | Contracts Oct 7 to 20 | Change |
|---|---|---|---|
| Under $200,000 | 85 | 59 | +26 |
| $200,000 to $249,999 | 45 | 33 | +12 |
| $250,000 to $299,999 | 62 | 43 | +19 |
| All houses under $300,000 | 192 | 135 | +57 |
| Houses at $300,000 and up | 210 | 216 | -6 |
Source: Momentum Research, computed from NEFAR MLS records, Duval County single-family listings, October 7 to November 3, 2026. Contracts count active listings that moved to active under contract or pending. Deemed reliable but not guaranteed.
The typical house in that group was modest. The median house that went into a contract under $300,000 in the second window had 1,296 square feet, and 133 of the 192 had three bedrooms. New construction played a small part: 21 of the 192 contracts were new homes, against 19 of 135 in the first window, so resale houses carried nearly all of the gain.
Where in Duval did contracts rise?
By ZIP code, these areas logged the most contracts under $300,000 in the second window:
| ZIP | Contracts Oct 21 to Nov 3 | Contracts Oct 7 to 20 | Price cuts Oct 21 to Nov 3 | New listings Oct 21 to Nov 3 |
|---|---|---|---|---|
| 32244 | 21 | 13 | 33 | 23 |
| 32210 | 20 | 13 | 46 | 39 |
| 32209 | 18 | 16 | 39 | 58 |
| 32218 | 17 | 9 | 23 | 20 |
| 32208 | 16 | 17 | 29 | 37 |
| 32219 | 15 | 14 | 10 | 13 |
| 32205 | 14 | 3 | 22 | 18 |
| 32206 | 10 | 5 | 3 | 31 |
Source: Momentum Research, computed from NEFAR MLS records, Duval County single-family listings under $300,000, October 7 to November 3, 2026. Deemed reliable but not guaranteed.
ZIP 32205 went from 3 contracts to 14. ZIP 32211 logged 42 price cuts against 9 contracts, but three listings there accounted for most of those cuts, each trimmed many times by small amounts, so the cut count overstates pressure in that ZIP.
Are sellers still cutting prices?
Yes, though slightly less often. Across all property types in Duval, the feed logged 998 price cuts from October 21 to November 3 against 508 contracts, about 2.0 cuts per contract. In the first window it logged 1,054 cuts against 459 contracts, about 2.3. The median cut across all types was 2.2 percent, or $6,000. New listings of houses under $300,000 rose from 328 to 358, so supply in the tier grew even as more houses went into a contract. Back-on-market moves in the tier held steady, at 45 against 46.
How much supply is on the market?
Our live map on November 3 showed 1,287 active Duval houses under $300,000 against 422 pending or under contract, about 3.0 to 1. The ratio was similar higher up: 3.2 to 1 from $300,000 to $399,999 (870 against 268) and from $400,000 to $499,999 (364 against 113), and 2.7 from $500,000 to $749,999. Houses from $750,000 to $999,999 ran tightest, at 1.8 to 1. Across all houses the ratio was 3.0 (3,122 against 1,048). Townhomes ran at 2.1 to 1 and condos at 4.8. The median active Duval listing had been on the market 62 days, and 478 had been listed 180 days or more.
What does this mean for buyers and sellers?
For buyers under $300,000, more competition for the same homes means less time to decide, but a median cut of $5,000 shows sellers are still adjusting. The full monthly cost includes taxes and insurance; our Duval County property tax page, Jacksonville home insurance cost page and Jacksonville flood zones by neighborhood page cover them.
For sellers, the entry tier drew the fastest response in the last two weeks, while houses above $300,000 held flat. Recent cut history is on our Duval County price cuts page, and countywide context is on the Duval County real estate page and the Jacksonville market page.
People also ask
Are Jacksonville home sales picking up?
Contracts on Duval County houses under $300,000 rose 42 percent in two weeks, from 135 between October 7 and 20 to 192 between October 21 and November 3, 2026. House contracts at $300,000 and up were flat, at 210 against 216.
What does a house under $300,000 in Jacksonville look like?
The median Duval house that went into a contract under $300,000 from October 21 to November 3, 2026 was listed at $217,000 with 1,296 square feet, and 133 of 192 had three bedrooms.
How many homes are for sale in Duval County under $300,000?
Our live map on November 3, 2026 showed 1,287 active Duval single-family houses under $300,000 and 422 pending or under contract, about 3.0 active listings per contract.
Limitations
Counts come from the change log of our live NEFAR MLS (realMLS) feed, which records a change when our refresh sees it; refreshes are lighter on weekends, and both windows include two weekends. Contracts count only active listings that moved to active under contract or pending, and a listing is counted once per window. Price bands use the list price at the time of the event. ZIP follows the listing record. The live map counts listings by mailing city (Jacksonville, Jacksonville Beach, Atlantic Beach, Neptune Beach and Baldwin), which can include a small number of addresses outside Duval County, and can differ from monthly inventory figures. Contracts can fall through. Two weeks is a short window, and one strong stretch is not a trend.
Sources
- Momentum Research, computed from NEFAR MLS records, Duval County (listing change log, October 7 to November 3, 2026; live map snapshot, November 3, 2026). Information is deemed reliable but is not guaranteed by the MLS to be accurate.
- Momentum Research, Northeast Florida Market Pulse.
- Full monthly series and per-feed attribution: Jacksonville market data
Disclosure: Jon Brooks is a co-founder of Momentum Realty, a Florida real estate brokerage that owns and funds Florida Housing Intelligence. Momentum has a financial interest in Florida real estate transactions, including in markets named here. See our editorial standards.
Market statistics in this article are computed from MLS data licensed by Momentum Realty, and are current as of the date shown. Data may be preliminary and subject to revision by its source. This article is general information, not advice about any specific property, transaction, or financial decision, and is not a representation about any specific property, community, builder, or association.
Equal Housing Opportunity. Editorial standards · Corrections · About