
Data Analysis
Kissimmee had 2,679 resale homes for sale and 354 under contract or pending on October 29, 2026, about 7.6 to 1, while new construction in the city ran 1.3 to 1.
Our live Stellar MLS map showed Osceola County resales at 6.8 listings per contract, against 3.6 to 1 in Seminole. Kissimmee townhome resales ran 12.9 to 1.
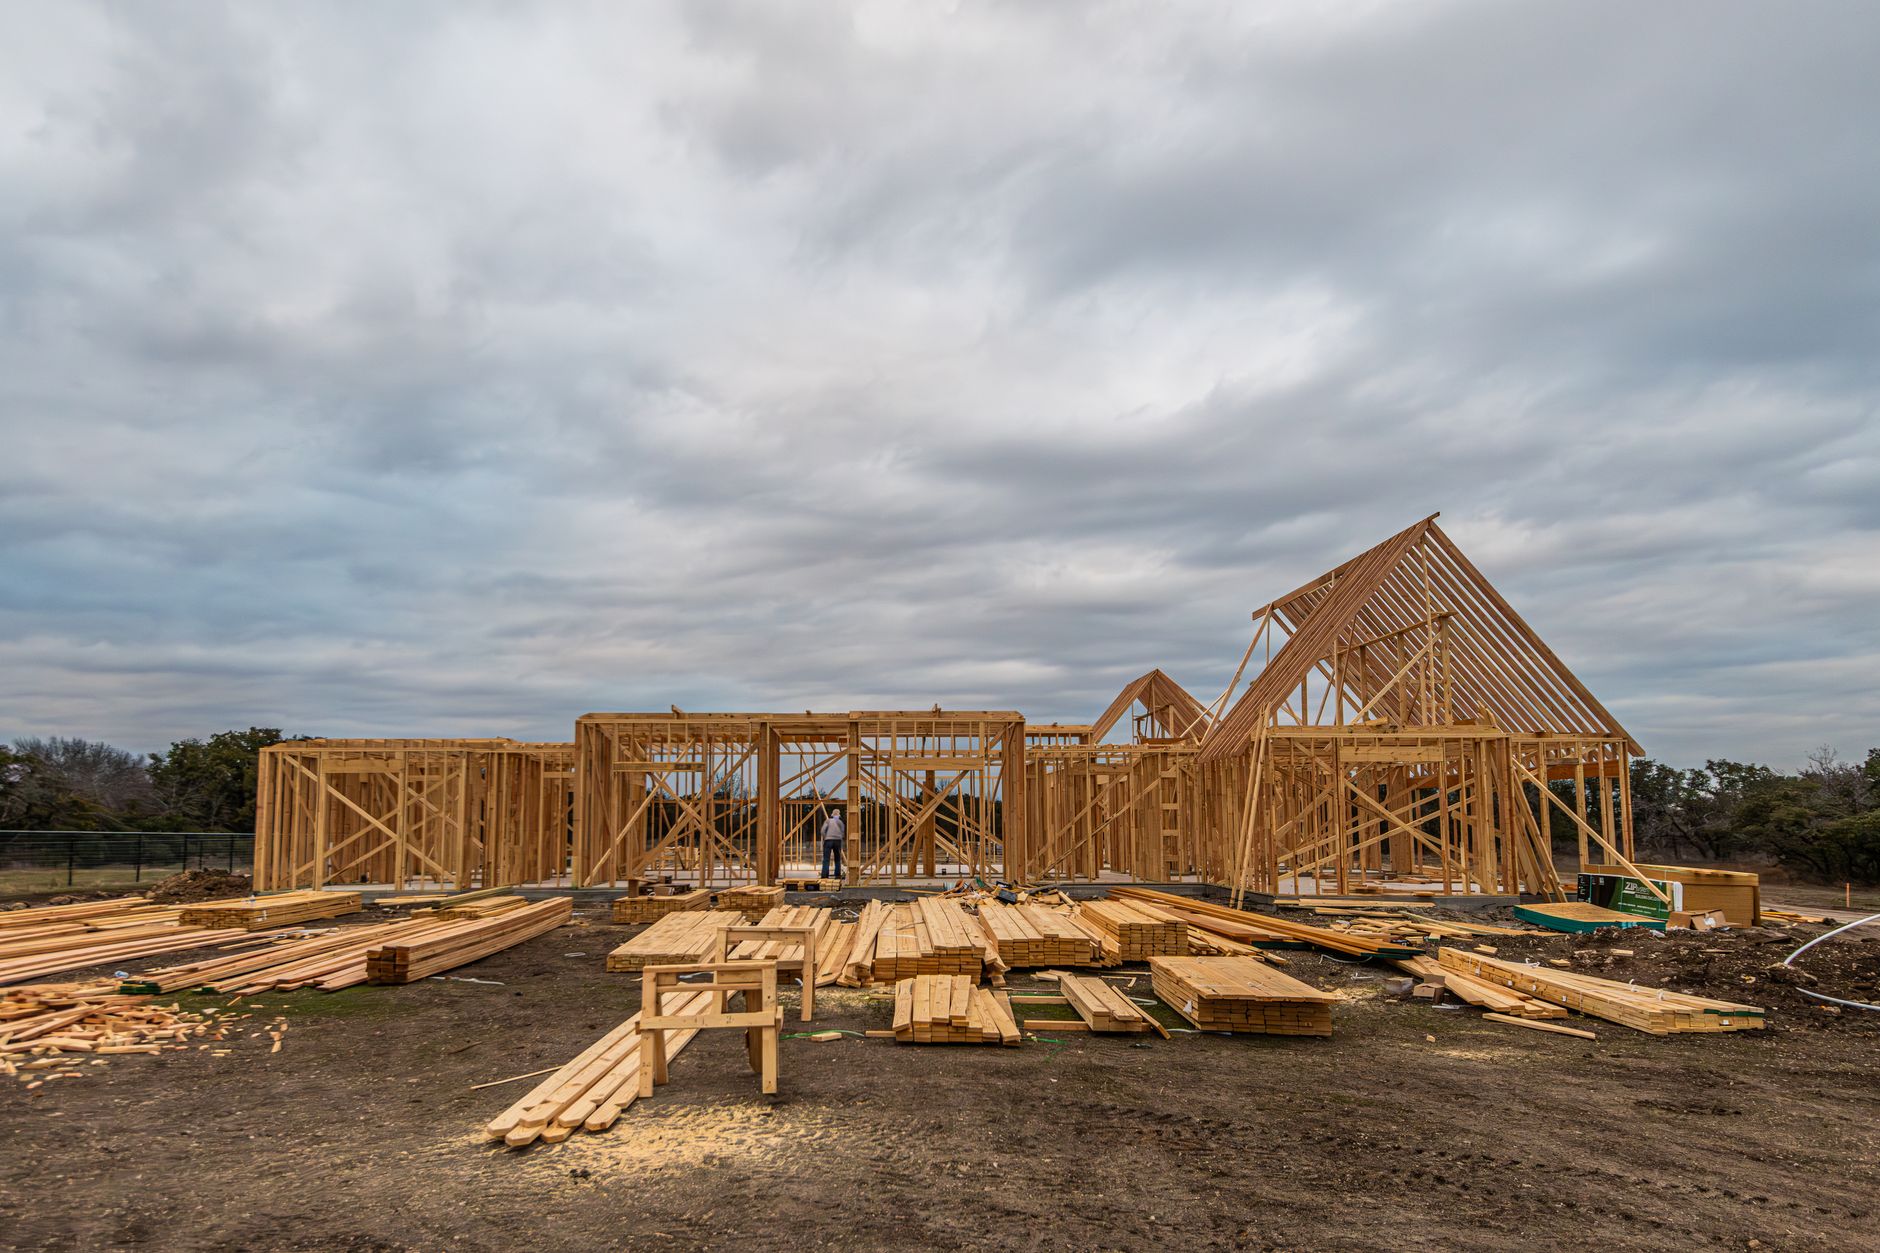
Our live Stellar MLS map showed 2,679 resale homes for sale and 354 resale homes under contract or pending in Kissimmee on October 29, 2026, about 7.6 listings for every one in a contract. New construction in the same city ran at 1.3 to 1, with 189 active and 146 in a contract. Resale townhomes were the slowest segment, at 694 active and 54 in a contract, about 12.9 to 1. Across the four-county Orlando area, resale homes ran at 4.7 to 1. All figures are ours, computed from Stellar MLS records; information is deemed reliable but not guaranteed.
This piece looks at live supply against contracts, not completed-month prices. September figures are in our Orlando median price, Orlando days on market and Orlando closed sales articles, and our October 26 roundup of Orlando-area coming-soon communities covers the builder pipeline. The full series sits on the Orlando market data hub.
How does Kissimmee compare with the rest of the Orlando area?
Osceola County carries the most resale supply relative to contracts of the four counties in our Orlando market. Seminole County resales were the tightest.
| County | Resale active | Resale under contract or pending | Active per contract | Median resale asking price | Median days listed |
|---|---|---|---|---|---|
| Orange | 5,372 | 1,262 | 4.3 | $410,000 | 73 |
| Osceola | 3,817 | 560 | 6.8 | $389,990 | 91 |
| Seminole | 1,503 | 421 | 3.6 | $375,000 | 64 |
| Lake | 2,556 | 576 | 4.4 | $374,900 | 77 |
| Four-county total | 13,248 | 2,819 | 4.7 | $390,000 | 77 |
Source: Momentum Research, computed from Stellar MLS records, live map snapshot, October 29, 2026. Resale excludes listings marked new construction. Deemed reliable but not guaranteed.
Within Osceola County, Kissimmee addresses held 2,679 of the 3,817 resale listings, about 70 percent. Of the Kissimmee resales, 726 had been listed 180 days or more and 204 had been listed a year or more. The median active Kissimmee resale had been on the market 95 days.
Which Kissimmee home types are slowest to sell?
Single-family resales were the largest group and the quickest of the Kissimmee resale types. Attached homes lagged.
| Kissimmee resale type | Active | Under contract or pending | Active per contract | Median asking price | Median days listed |
|---|---|---|---|---|---|
| Single-family | 1,544 | 254 | 6.1 | $445,000 | 86 |
| Townhouse | 694 | 54 | 12.9 | $330,000 | 107.5 |
| Condo | 385 | 37 | 10.4 | $225,400 | 112 |
| Villa | 36 | 2 | 18.0 | $272,500 | 107 |
Source: Momentum Research, computed from Stellar MLS records, live map snapshot, October 29, 2026. Property type follows the MLS field. Deemed reliable but not guaranteed.
Townhomes and condos together made up 1,079 of the 2,679 Kissimmee resale listings, or 40 percent, but only 91 of the 354 resale contracts, about 26 percent. Of the 694 active townhome resales, 210 had been listed 180 days or more. Condo buildings and associations in the area are listed on our Kissimmee condo communities and Osceola County condo communities pages.
Do Kissimmee resale prices matter for contract pace?
Yes. The ratio climbs with price. Kissimmee resales under $250,000 ran at 5.2 to 1, with 390 active and 75 in a contract. From $250,000 to $349,999 the ratio was 7.1 to 1, and from $350,000 to $499,999 it was 7.9 to 1, with 880 active and 111 in a contract. Above $500,000 the gap widened: 473 active and 47 in a contract from $500,000 to $749,999, about 10.1 to 1, and 168 active against 13 in a contract at $750,000 and above.
Why is St. Cloud moving faster than Kissimmee?
St. Cloud, the other large Osceola city, had 1,110 active listings and 406 in a contract, about 2.7 to 1. New construction drives much of that pace. St. Cloud had 342 active new-construction listings and 255 in a contract, so builders accounted for 63 percent of the city's contracts. St. Cloud resales ran at 5.1 to 1, with 768 active and 151 in a contract, faster than Kissimmee resales but slower than the Orlando-area resale average.
Across Osceola County, new construction ran at 1.3 to 1, with 549 active and 409 in a contract, and builders held 409 of the county's 969 contracts. The median new-construction listing in a contract was priced at $391,530, against $364,950 for resales in a contract. Builder communities in the county often carry community development district or association fees, which our CDD fees guide explains.
Place pages with recent sales are at Kissimmee, St. Cloud, Celebration and Reunion. Reunion addresses had 155 active listings and 17 in a contract, about 9.1 to 1, with a median of 165 days listed.
What does this mean for buyers and sellers in Kissimmee?
For buyers, Kissimmee resales offer the widest choice in the Orlando area, especially townhomes, condos and homes above $500,000, and more than a quarter of active resales have passed 180 days. That can leave room on price and terms, though each listing differs. Insurance budgets for the area are on our Kissimmee home insurance cost page.
For resale sellers, the comparison is often with new construction a few miles away. Builder homes in Osceola County are going under contract at about 1.3 listings per contract, against 6.8 for resales, so pricing against recent resale closings in the same community matters.
People also ask
How many homes are for sale in Kissimmee, Florida?
Our live Stellar MLS map showed 2,868 active listings with Kissimmee addresses in Osceola County on October 29, 2026, including 2,679 resales and 189 new-construction homes. Another 500 were under contract or pending.
Is the Kissimmee housing market slow?
Resales in Kissimmee are slower than the Orlando-area average. On October 29, 2026, there were about 7.6 resale listings for every resale contract in Kissimmee, against 4.7 to 1 across Orange, Osceola, Seminole and Lake counties.
Are new homes selling faster than resales in Osceola County?
Yes. On October 29, 2026, Osceola County new construction had about 1.3 active listings per contract, against 6.8 for resales. Builders accounted for 409 of the county's 969 listings under contract or pending.
Limitations
Figures are a single live map snapshot taken October 29, 2026, not monthly totals, and can differ from inventory counts in monthly reports. Counties are assigned from each listing's county record where our feed has one and otherwise from the listing city, so a small number of listings near county lines may be placed in a neighboring county. Cities follow the listing address, which can differ from city limits. Under contract or pending includes listings marked either way in the MLS; coming-soon listings are excluded. New construction follows the MLS flag, and resale means every other listing. Days listed is the listing's current count as reported to our feed and may reset when a listing is withdrawn and relisted. Figures may be revised as the MLS updates records. This article is general information, not advice about any specific property or transaction.
Sources
- Momentum Research, computed from Stellar MLS records as distributed by MLS GRID, live map snapshot, October 29, 2026. Information deemed reliable but not guaranteed.
- Orlando market data hub, Momentum Research.
Disclosure: Jon Brooks is a co-founder of Momentum Realty, a Florida real estate brokerage that owns and funds Florida Housing Intelligence. Momentum has a financial interest in Florida real estate transactions, including in markets named here. See our editorial standards.
Market statistics in this article are computed from MLS data licensed by Momentum Realty, and are current as of the date shown. Data may be preliminary and subject to revision by its source. This article is general information, not advice about any specific property, transaction, or financial decision, and is not a representation about any specific property, community, builder, or association.
Equal Housing Opportunity. Editorial standards · Corrections · About