
Data Analysis
Pinellas County sellers cut asking prices on 717 listings while 311 homes went under contract from October 21 to November 3, 2026, about 2.3 cuts for every new contract.
Pinellas condos logged 2.7 price cuts per new contract and beach towns 3.4, while houses at $750,000 and up ran close to one to one.
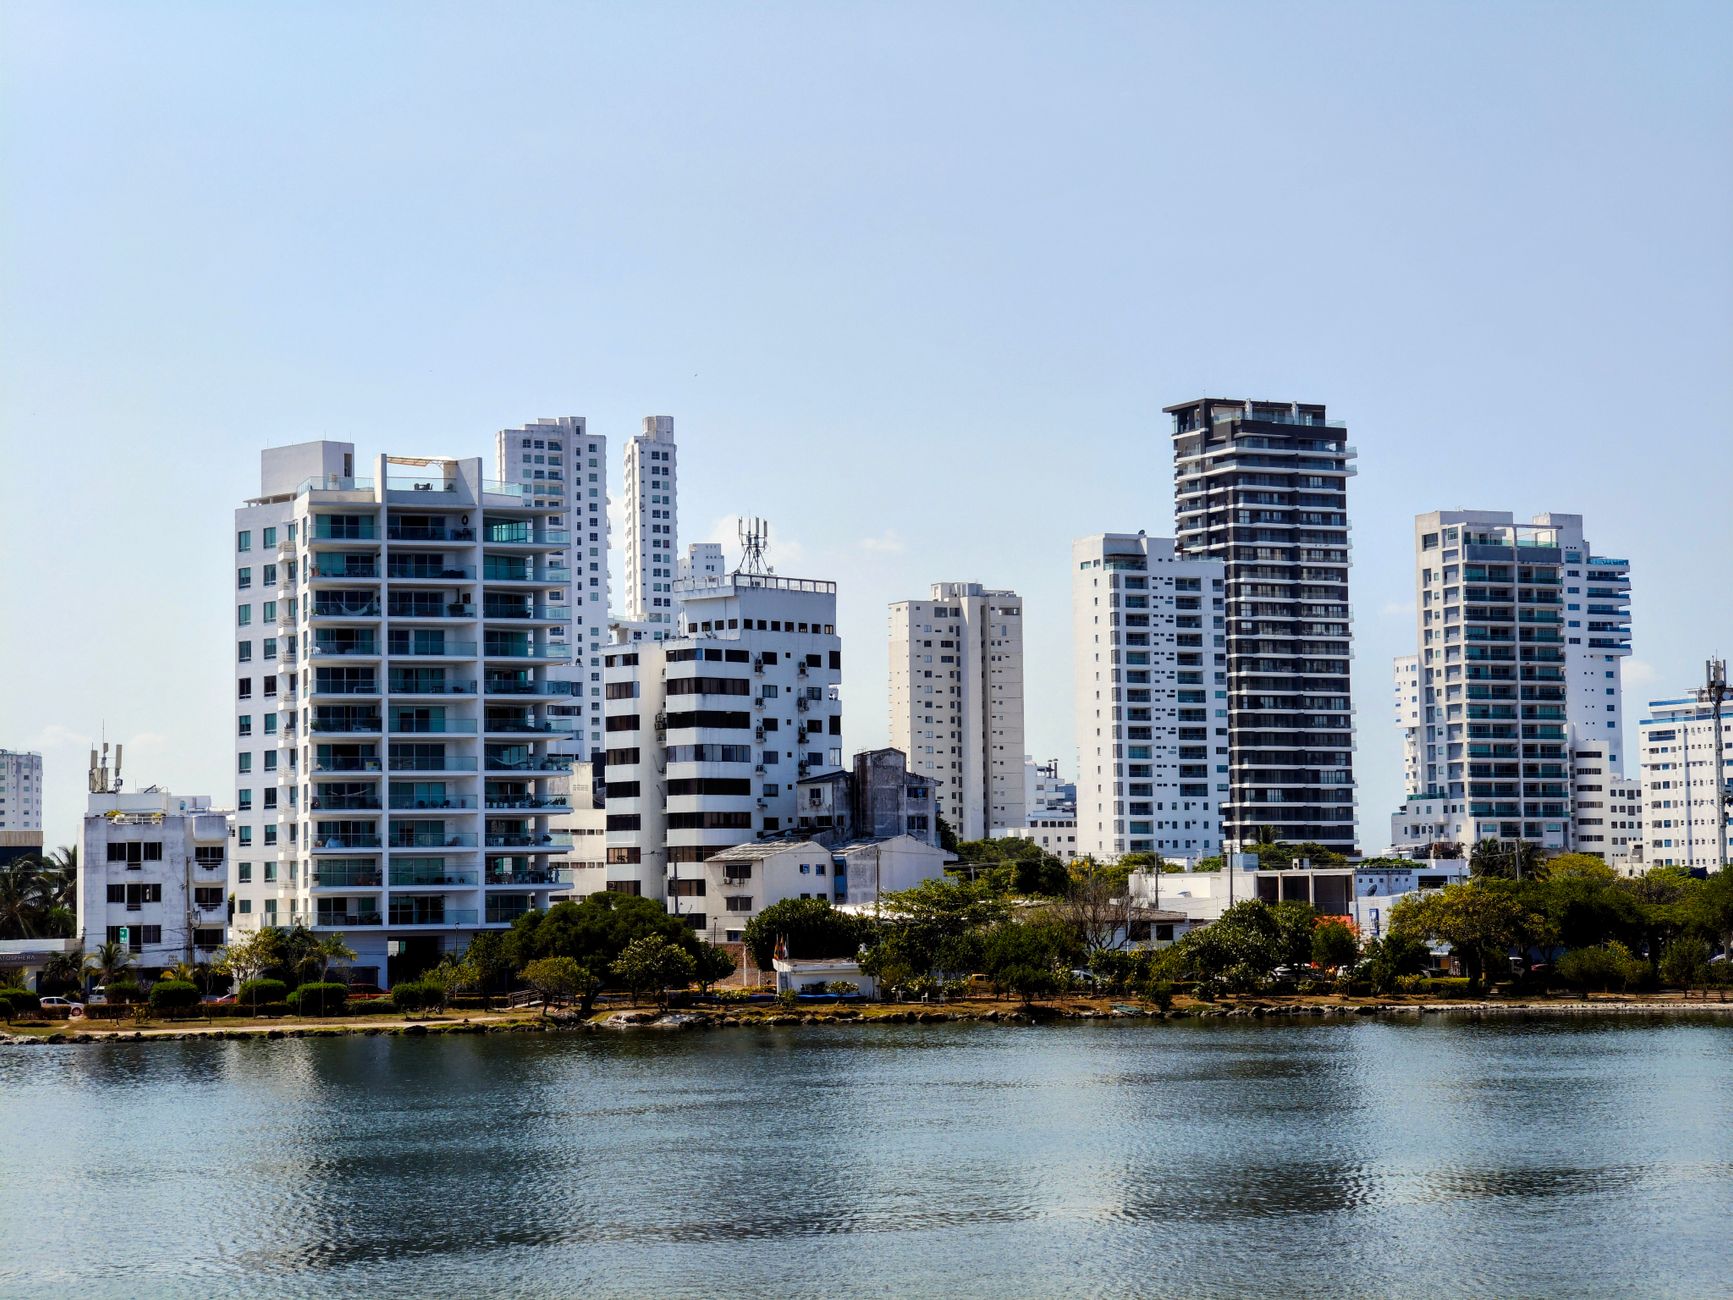
From October 21 through November 3, 2026, our live Stellar MLS feed logged 717 Pinellas County listings with a price cut and 311 listings moving from active into a contract, about 2.3 cuts for every new contract. The median cut was 3.28 percent, or $10,600, and 66 cuts reached 10 percent or more. Condos ran at 2.7 cuts per contract, the county's beach towns at 3.4, and single-family houses listed at $750,000 to $999,999 at 1.1. On November 4 our live map showed 6,871 active listings against 1,520 in contract, about 4.5 to 1. All figures are ours, computed from Stellar MLS records; information is deemed reliable but not guaranteed.
This is a two-week read on price cuts and new contracts. Completed-month figures sit in our St. Petersburg median price, days on market and closed sales articles, and the full series is on the St. Petersburg market data hub. Our November 2 article on Pinellas houses under $400,000 covered the entry tier on its own.
How many Pinellas sellers cut prices in late October?
The feed logged price cuts on 717 listings over the 14 days, against 311 new contracts and 544 new listings. Another 64 homes came back on the market after a contract ended. A cut-to-contract ratio above 2 means more sellers were lowering asking prices than buyers were signing contracts.
| Home type | Price cuts | New contracts | Cuts per contract | Median cut |
|---|---|---|---|---|
| Single-family | 395 | 183 | 2.2 | 2.92% ($14,900) |
| Condo | 233 | 86 | 2.7 | 4.00% ($10,000) |
| Townhouse | 39 | 12 | 3.2 | 3.23% ($14,900) |
| Villa | 22 | 15 | 1.5 | 4.38% ($10,000) |
| Mobile and manufactured | 21 | 14 | 1.5 | 4.57% ($6,000) |
| All listings | 717 | 311 | 2.3 | 3.28% ($10,600) |
Source: Momentum Research, computed from Stellar MLS records, Pinellas County, October 21 to November 3, 2026. Each listing is counted once per category. Deemed reliable but not guaranteed.
Condos carried the deepest cuts. Of the 66 cuts of 10 percent or more, 28 were condos, and condos listed under $300,000 logged 161 cuts against 51 contracts, about 3.2 per contract.
Which single-family price bands are moving?
The top of the market moved faster than the middle. Houses listed at $750,000 to $999,999 logged 26 cuts against 24 contracts, and houses at $1 million and up logged 50 cuts against 37 contracts, about 1.4 per contract. The middle bands ran slower.
| Single-family list price | Price cuts | New contracts | Cuts per contract |
|---|---|---|---|
| Under $300,000 | 44 | 25 | 1.8 |
| $300,000 to $499,999 | 171 | 64 | 2.7 |
| $500,000 to $749,999 | 104 | 33 | 3.2 |
| $750,000 to $999,999 | 26 | 24 | 1.1 |
| $1 million and above | 50 | 37 | 1.4 |
Source: Momentum Research, computed from Stellar MLS records, Pinellas County, October 21 to November 3, 2026. Deemed reliable but not guaranteed.
Cuts in the $1 million tier were larger in dollars, with a median of 4.88 percent or $100,000. In the $300,000 to $499,999 band the median cut was 2.78 percent, about $10,000.
Where in Pinellas are cuts outpacing contracts?
By mailing city, the gap was widest in Dunedin and the beach towns, and narrowest in Safety Harbor and Largo.
| Mailing city | Price cuts | New contracts | Cuts per contract |
|---|---|---|---|
| St. Petersburg | 229 | 87 | 2.6 |
| Clearwater | 115 | 51 | 2.3 |
| Palm Harbor | 51 | 24 | 2.1 |
| Largo | 46 | 32 | 1.4 |
| Dunedin | 35 | 6 | 5.8 |
| Pinellas Park | 33 | 14 | 2.4 |
| Seminole | 32 | 21 | 1.5 |
| Tarpon Springs | 31 | 12 | 2.6 |
| Oldsmar | 17 | 9 | 1.9 |
| Safety Harbor | 11 | 10 | 1.1 |
Source: Momentum Research, computed from Stellar MLS records, October 21 to November 3, 2026. Deemed reliable but not guaranteed. Smaller places not shown.
The ten barrier island and beach mailing cities, from Clearwater Beach and Belleair Beach south to St. Pete Beach, logged 75 cuts against 22 contracts, about 3.4 per contract, with a median cut of 4.05 percent or $25,000. The rest of the county ran at 2.2. Clearwater Beach alone logged 17 cuts and 4 contracts. Local prices and recent sales are on the St. Petersburg, Clearwater, Largo, Dunedin, Palm Harbor, Safety Harbor and Clearwater Beach market pages.
New construction was a small share. Builders' listings logged 13 cuts against 8 contracts, with a median cut of 1.82 percent, against 3.30 percent on resale listings.
How much supply is on the Pinellas market?
On November 4, 2026 our live map showed 6,871 active Pinellas listings and 1,520 pending or under contract.
| Home type | Active | In contract | Listings per contract | Median days listed |
|---|---|---|---|---|
| Single-family | 3,026 | 921 | 3.3 | 66 |
| Condo | 2,836 | 403 | 7.0 | 94 |
| Townhouse | 447 | 91 | 4.9 | 95 |
| Villa | 218 | 57 | 3.8 | 102 |
| Mobile and manufactured | 311 | 43 | 7.2 | 104 |
Source: Momentum Research, computed from Stellar MLS records, Pinellas County, live map snapshot, November 4, 2026. In contract combines pending and under contract. Deemed reliable but not guaranteed.
Condos had more than twice as many listings per contract as houses. Our October articles on Pinellas condos under contract and Pinellas flood zone listings look at those two pressures in more detail.
What does this mean for buyers and sellers?
For buyers, a ratio above 2 points to room to negotiate, most of all on condos under $300,000, townhomes and beach town listings, where cuts were frequent and deep. Insurance, flood and association costs belong in any budget; our St. Petersburg home insurance cost page and Florida condo special assessments guide cover those.
For sellers, the faster bands were at the ends of the single-family market: houses under $300,000 and houses at $750,000 and up drew contracts closer to the rate of cuts. Sellers in the $500,000 to $749,999 band faced 3.2 cuts per contract from competing listings.
People also ask
Are home prices dropping in St. Petersburg?
Asking prices are being cut often. From October 21 to November 3, 2026, our Stellar MLS feed logged price cuts on 717 Pinellas County listings, with a median cut of 3.28 percent, against 311 new contracts. Closed-sale medians are in our monthly St. Petersburg median price articles.
Are Pinellas condo prices falling?
Condo sellers cut more often and by more. Pinellas condos logged 233 price cuts against 86 new contracts in the two weeks to November 3, 2026, and the median condo cut was 4.0 percent, or $10,000.
How many homes are for sale in Pinellas County?
Our live map showed 6,871 active listings in Pinellas County on November 4, 2026, with 1,520 pending or under contract: 3,026 active single-family houses and 2,836 active condos.
Limitations
Counts come from the change log of our live Stellar MLS feed, which records a change when our refresh sees it. The feed logged few or no changes on some days in the window, including October 22, 25 and 26, so the totals are a floor and are not compared with earlier weeks here; the cut-to-contract ratio is less affected because both counts share the same refresh gaps. Each listing is counted once per category per window. New contracts are moves from active to active under contract or pending. City follows the listing's mailing city. The live snapshot is a single day and shifts as listings change. Builder sales recorded outside the MLS are not counted.
Sources
- Momentum Research, computed from Stellar MLS records, Pinellas County (listing change log, October 21 to November 3, 2026; live map snapshot, November 4, 2026). Information is deemed reliable but is not guaranteed by the MLS to be accurate.
- Momentum Research, Stellar MLS Market Pulse.
- Full monthly series and per-feed attribution: St. Petersburg market data
Disclosure: Jon Brooks is a co-founder of Momentum Realty, a Florida real estate brokerage that owns and funds Florida Housing Intelligence. Momentum has a financial interest in Florida real estate transactions, including in markets named here. See our editorial standards.
Market statistics in this article are computed from MLS data licensed by Momentum Realty, and are current as of the date shown. Data may be preliminary and subject to revision by its source. This article is general information, not advice about any specific property, transaction, or financial decision, and is not a representation about any specific property, community, builder, or association.
Equal Housing Opportunity. Editorial standards · Corrections · About