
Parker
Homes for Sale in Panama City, FL
All 245 homes for sale in Panama City, FL · median $349,900 · 117 homes for sale in 32401 · Bay County homes for sale
True comps, carrying-cost math, and listings before the portals.
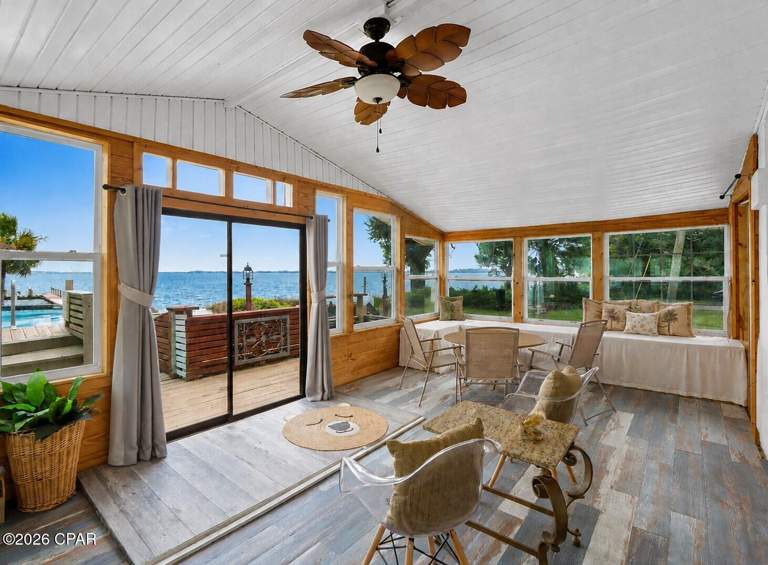
Photo via CPAR MLS
As of October 2026, Parker in Panama City, FL has 3 homes for sale. Homes listed or recently sold were built 1958–2026 with 1 new construction; 1 of the 4 geocoded homes sit in a FEMA special flood hazard zone (median elevation 22 ft).
Last 30 days in Parker: 3 new listings (median asking $325,000), 1 under contract right now. As of October 20, 2026, Listing information provided by the Central Panhandle Association of REALTORS®. Information is deemed reliable but not guaranteed by the MLS to be accurate.
Homes For Sale Right Now in Parker
Live MLS inventory for Parker. Every active listing, what is under contract right now, and the last 12 months of closed sales, refreshed twice a day. Closed comps beat an algorithm's guess every time.
Active and pending Parker listings as of 2026-10-19, priced high to low. Listing information provided by the Central Panhandle Association of REALTORS®. Information is deemed reliable but not guaranteed by the MLS to be accurate. Tap any home to ask about it.

Parker's median price of $388,750 sits on a market that's still finding its footing after a sharp year-over-year swing of 75.1%. That kind of movement usually means the comparable set is thin or condition-driven rather than a broad, steady climb, so sellers should price off recent, similar closings rather than the headline number alone.
With only 4 closings in the current window and a median 18.5 days on market, this is a market that moves fast when a listing is priced right, but there isn't a deep enough sales record yet to lean on averages with confidence. Buyers and sellers both benefit from a closer look at the specific comps behind any offer or listing price here.
Figures in this note are as of July 28, 2026. The live market numbers elsewhere on this page update nightly and are newer.
The 60-Second Overview
Parker is an established Bay County community with homes built across a broad span, from 1900 through 2024, and a median build year of 1979 — meaning most inventory carries some age and buyers should expect a range of renovation states rather than uniform new construction.
CPAR sales records identify 13 homes in Parker that have changed hands since 2022, built between 1940 and 2026 (median 1984), with a median living area of about 1,012 sq ft and a typical 3-bedroom, 1.5-bath layout. Source: CPAR closed-sale history compiled by Momentum Research; counts reflect homes with a recorded MLS sale, not every home in the community.
Pre-construction details are compiled from public records, builder announcements and builder listings, and are subject to change without notice; figures are deemed reliable but not guaranteed. Momentum Research figures are our own analysis. This page describes homes, pricing and community attributes, not residents.
The setting & the homes.
Aerial and on-site photos of Parker. Swipe to explore the community.
Swipe or use the arrows → tap any photo to enlarge
 Parker
 Parker
 Parker
 Parker
Photos from CPAR MLS listings in Parker; content deemed reliable but not guaranteed.
Who Parker is best for.
Best for
- Buyers who plan to evaluate each home's condition and updates individually rather than relying on a neighborhood-wide price expectation.
- Buyers comfortable moving decisively in a market where well-priced homes have recently sold in under three weeks.
- Sellers with a well-maintained or updated home who want pricing built from close, current comps rather than a broad median.
Probably not for
- Buyers who want a built-in amenity package as part of the purchase decision.
- Buyers who need a large, stable sales history to feel confident in a valuation — the current closings window is limited.
- Buyers seeking uniform new construction, given the community's wide year-built range.
The market around Parker
Parker is too small for its own price trend, so here is the market around it.
In ZIP 32401, 145 homes are on the market and 15% are under contract — a slower corner of Panama City.
Across Bay County, 2,515 homes are active and 528 pending (17% under contract).
In ZIP 32401 (Panama City), 337 homes closed in the last 12 months at a median of $307K, up 0.5% year over year, with a median 62 days on market. Right now 166 active and 29 pending listings — a buyer's market. See the live ZIP 32401 housing market and the Bay County market.
ZIP and county figures describe the wider market, not Parker specifically. Momentum Research analysis of MLS records.
Parker on the map.
Every active, pending, and recently sold home, plotted. Toggle the layers and tap a home for the details.
Listing locations from CPAR MLS. Map data © OpenStreetMap contributors.
The Parker buying strategy.
If we were buying in Parker today, this is the order of operations we would run for our clients.
Underwrite the condition first. Price the roof, HVAC, and systems honestly before judging any list price; condition swings value here more than square footage alone.
Match the home to real comps. Recent sales of similar condition and lot, not the asking price, tell you what a home is worth.
Move deliberately, not desperately. Neither side has a decisive edge, so a well-prepared, fairly-priced offer wins without overpaying.
Line up financing and inspection early. A pre-approval and an inspection plan let you act fast and negotiate from evidence.
Keep an agent in your corner. The listing agent works for the seller; we represent you and prepare a hand-built valuation before any offer in Parker.
A market defined by condition, not category
At 613 homes and a median living area of 1,943 square feet, Parker offers a reasonably sized inventory base, but the wide year-built range (1900–2024) means the deciding factor on value is almost always the individual home's condition and updates rather than its size or location alone. A homestead share of 53.6% suggests a solid core of longer-term ownership, which can mean less turnover-driven inventory at any given time.
The market heat score of 63 points to solid, not frantic, competition — enough demand to move a well-priced, well-presented home quickly, but not so much that pricing discipline stops mattering. No community amenities are currently identified from MLS listings, so buyers weighing lifestyle features should verify directly what, if anything, is attached to a specific property rather than assuming a shared amenity package.
The location and the amenities are priced into every listing in Parker. The deal is won or lost on condition, the comps, and the renovation math.
Why work with Momentum here
In a market with a wide build-year spread and only a handful of recent closings to reference, pricing a Parker home well takes more than pulling the median — it takes pulling the right comps for the home's actual age and condition. We do that work before a number ever goes on a listing or into an offer.
Parker in 15 seconds.
What it really costs to own in Parker
The parts of the monthly number a mortgage calculator leaves out, from the tax roll, the MLS, Citizens and FEMA. Property facts only.
| Property tax | Current owners' bills run a median of $1,747/yr across 6 listings here (MLS tax records, 2026-10-20). |
|---|---|
| Home and flood insurance | The average Citizens Property Insurance premium in Bay County is $1,928/yr (1,264 policies, Citizens detail by county, April 2026); private-market quotes depend on roof age, wind mitigation and construction. |
| Roof and age | Median build year 1971 across 8 listings. An original roof here would be about 55 years old; under Florida's 2022 reform (SB 2-D) carriers may require an inspection past 15 years, so budget for a roof report, and for replacement where it fails. |
Email me new listings in Parker
One e-mail a day, only when a home lists here, with price, beds, baths and a link to every listing. Straight from the MLS feed; no account needed.
Ask an agent about Parker
Have a question about the homes, fees, rules or commute here? A Momentum agent who works Parker will answer, and the answer is published on this page for the next buyer.
HOA, CDD & Fees
- HOA status not on record. Verify any dues before you offer
- Any club/amenity membership is billed separately
Confirm the current HOA dues, exactly what they cover, and any CDD bond or special assessment for a specific address before you offer.
Tools for a Parker buy.
Free calculators to pressure-test the real cost before you tour.
Selling here is won on condition and pricing to real comps, not an automated estimate. The right number comes from closed Parker sales matched to your home.
Price it to the comps and condition, not an automated estimate.
If you are thinking about selling in Parker, the right list price comes from recent comparable sales matched to your home's condition and location, not an automated estimate.
What is your Parker home worth?
Get a no-obligation home value based on real comparable sales in Parker, not an automated guess. Tell us about your home and we will personally prepare your numbers and a pricing strategy. No obligation, no spam.
See all homes for sale in Panama City →
Should you buy in Parker?
An honest fit check. We will tell you when it is not your community.
Data sources & freshness
| Live listings | CPAR MLS, refreshed twice daily (last: October 19, 2026) |
| Under-contract shares | CPAR MLS records, as of 2026-09-20 |
| Historical depth | Closed-sale records back to 2012 (57 transactions analyzed) |
Verify the primary sources yourself: Florida DOR · U.S. Census · FEMA flood maps · Citizens Property Insurance.
Momentum Research figures are our own analysis of CPAR MLS records; MLS data is deemed reliable but not guaranteed. Methodology: how Momentum market scores are computed. Market metrics describe homes for sale and recent sales, not residents.
Own a home here?
You just read the data. Now see what your home is worth.
The numbers on this page move markets in the aggregate. The number that matters to you is what a buyer pays for your address. Momentum sells for 1.25% above the CPAR MLS member average and 8 days faster, and we’ll price yours against live local comps.
Looking to buy here? Search homes for sale →
What’s your home worth in your area?
A real valuation with real comps from a local listing agent, not an instant algorithm. Response within one business day.
See how Parker fits the bigger picture — live prices, inventory, and Momentum Scores:
More on Parker
- Home values · What homes in Parker actually sell for
Common questions about Parker
Where is Parker?
Parker is a community in Panama City, Bay County, Florida, ZIP 32401 / 32404 / 32456.
Are there homes for sale in Parker right now?
Yes — 3 active and 1 pending listings as of the last feed refresh (twice daily). They are listed on this page.
Does Parker have an HOA or CDD?
No HOA is on record for Parker in our data. Verify dues, what they cover, and any special assessment for a specific address before you offer.
Answers are generated from county property records, MLS feeds and the figures on this page, as of the page date; deemed reliable but not guaranteed.
Housing distress & ownership in Parker, Panama City
Who owns here, how much is not owner-occupied, and how much for-sale inventory is under distress.
Source: Momentum Realty Research. Ownership & parcels from the FL DOR 2025 tax roll; distress from MLS active-listing status/remarks; price from MLS closed sales. Listing information provided by the Central Panhandle Association of REALTORS®. Information is deemed reliable but not guaranteed by the MLS to be accurate. Deemed reliable but not guaranteed.
Every Home for Sale in Parker Right Now (4)
All 4 active and pending Parker listings with a detail page, newest first, refreshed twice a day from the MLS.
- 605 Arrow Street, Panama City, Fl 32404 · $325,000 · 3 bd / 2 ba · listed Oct 16, 2026 · listed by Overstreet Realty
- 5136 Lake Drive, Panama City, Fl 32404 · $309,000 · 3 bd / 2 ba · listed Sep 11, 2026 · listed by Hilltop Legacy Realty
- 5119 Marla Drive, Panama City, Fl 32404 · $199,500 · 3 bd / 2 ba · pending · listed Aug 29, 2026 · listed by Think Real Estate
- 4700 E 6th Street, Panama City, Fl 32404 · $599,000 · 3 bd / 2 ba · listed Aug 21, 2026 · listed by Legacy Premier Agency
More Panama City home searches
- All homes for sale in Panama City, FL
- Homes for sale in Bay County, FL
- Homes under $300K in Panama City
- Homes from $300K to $500K in Panama City
- 4-bedroom homes for sale in Panama City
- Panama City home values: what is my house worth?
- ZIP 32401 housing scorecard
- 3 coming-soon communities in Bay County
Panama City guides & data
- Market data
- Best neighborhoods (ranked by data)
- Flood zones
- Home insurance cost
- New construction
- ZIP codes
Florida buyer guides
- Florida home insurance rates by county
- Florida property tax by county
- Florida property tax calculator
- What flood zone X means
- The 4-point inspection, explained
- Florida flood insurance calculator
Real estate agent in Panama City? Join Momentum in Panama City: 100% commission, one $12K cap.
Nearby Communities
Explore more neighborhoods near Parker with Momentum Realty’s local guides.