
Oakland
Homes for Sale in Miami, FL
All 4,658 homes for sale in Miami, FL · median $520,990 · 428 townhomes for sale in Miami · 65 homes for sale in 33185 · Miami-Dade County homes for sale
True comps, carrying-cost math, and listings before the portals.
Market Heat
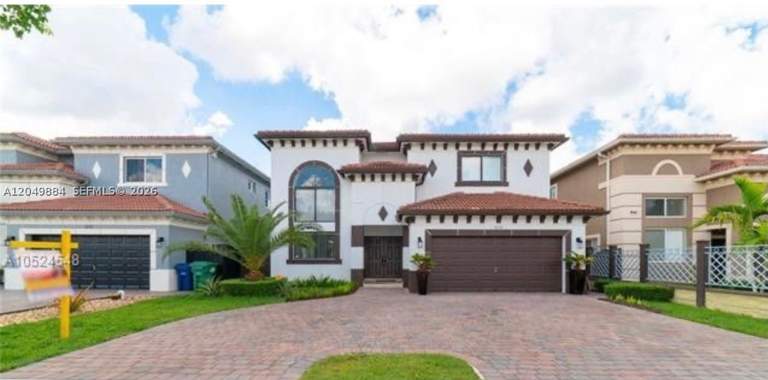
Photo via MIAMI MLS
As of October 2026, Oakland Subdivision in Miami, FL has 3 homes for sale. Over the 12 months ending 2026-09-20, 5 recorded sales closed at a median of $850,000, $354 per square foot, a median 9 days on market, sellers accepting 95% of original asking (+54% versus the prior year). Homes listed or recently sold were built 2013–2016. At the median price and Miami-Dade County's FY2025-26 rate of 17.59 mills, annual property tax runs about $14,950 ($14,240 with the full homestead exemption).
Last 30 days in Oakland: 2 new listings (median asking $868,500). As of October 20, 2026, Listing information provided by the Southeast Florida MLS (SEFMLS) / MIAMI Association of REALTORS(R). Information is deemed reliable but not guaranteed by the MLS to be accurate.
Homes For Sale Right Now in Oakland
Live MLS inventory for Oakland. Every active listing, what is under contract right now, and the last 12 months of closed sales, refreshed twice a day. Closed comps beat an algorithm's guess every time.
Active and pending Oakland listings as of 2026-10-18, priced high to low. Based on information from the Southeast Florida Multiple Listing Service (SEFMLS) or from MIAMI Association of REALTORS(R) for the period 2012 through 2026. Tap any home to ask about it.

Oakland Subdivision's numbers right now are driven by a very thin trading window — three closings is the entire basis for the current median and year-over-year read. That median, $850,000, and a median price per square foot of $354.31 tell you homes here are transacting at a premium level, but with only three data points, a single high-condition sale or a single fixer can swing the averages hard in either direction next quarter.
A 9-day median days on market and a 54.5% year-over-year change point to a market where whatever does list is moving fast and pricing has shifted meaningfully versus a year ago. For a seller, that combination argues for pricing with confidence rather than testing the market. For a buyer, it means moving decisively once a listing fits, since the sample size working against you here is small inventory, not soft demand.
Figures in this note are as of July 22, 2026. The live market numbers elsewhere on this page update nightly and are newer.
Oakland right now
🟢 Still climbing. The trailing-12-month median ($850K) is up 54.5% from the prior 12 months ($550K). With about 5 sales a year, a single closing can swing this number, so read the level and the decade, not one year's move.Momentum Research, record-level MIAMI MLS closed sales, 12-month windows ending September 20. Confidence: Low (5 and 3 sales in the two windows).
Jump to: Price history & scorecard · Homes for sale · Schools · FAQ
· Updated October 20, 2026 · Live data: MIAMI MLS, refreshed twice daily · MLS facts carry their source; interpretation lines are Momentum Research · Data sources & freshness
The 60-Second Overview
Oakland market snapshot (as of September 20, 2026): the median sale price is about $850K ($354 per sq ft over the trailing 12 months of closed sales), and a median 9 days on market for closed sales. The trailing-12-month median is up 54% from the prior 12 months, computed from record-level MIAMI MLS closed sales (5 closings in the current window).
In ZIP 33185 (Miami), 155 homes closed in the last 12 months at a median of $715K ($323/sq ft), down 0.1% year over year, with a median 58 days on market. Right now 51 active and 15 pending listings — a balanced market. See the live ZIP 33185 housing market and the Miami-Dade County market.
MIAMI REALTORS sales records identify 55 homes in OAKLAND that have changed hands since 2011, built between 2008 and 2017 (median 2014), with a median living area of about 1,704 sq ft and a typical 4-bedroom, 3-bath layout. Source: MIAMI REALTORS closed-sale history compiled by Momentum Research; counts reflect homes with a recorded MLS sale, not every home in the community.
Oakland Subdivision is a low-volume corner of the Miami-Dade market where recent activity has been limited to a handful of sales, so current figures should be read as a directional signal rather than a settled baseline.
The setting & the homes.
Aerial and on-site photos of Oakland. Swipe to explore the community.
Swipe or use the arrows → tap any photo to enlarge
 Oakland
 Oakland
 Oakland
Photos from MIAMI MLS listings in Oakland; content deemed reliable but not guaranteed.
Who Oakland is best for.
Best for
- Buyers targeting a specific home or lot in this pocket who are comfortable pricing off a small comp set.
- Sellers with a property in strong condition who want to capitalize on a fast median days-on-market pace.
- Buyers with flexibility on timing who can move quickly once a listing that fits their budget appears.
Probably not for
- Buyers who want a deep pool of recent comparable sales before committing to a price.
- Anyone specifically shopping for built-in community amenities, since none are identified in current listings.
- Buyers uncomfortable with the pricing volatility that comes from a market this thinly traded.
Price History: What Homes Here Have Actually Sold For
Median sale price over the trailing 12 months ending September 20 of each year, from record-level MIAMI MLS closed sales. Same methodology as every appreciation figure on this page: the 2026 point ($850K) IS the median in the snapshot above, and the move from 2025 ($550K) IS the +54.5% one-year change.
Windows contain 0 to 12 sales each (5 in the current window); every figure carries its sample size, and thin markets swing on single closings. Based on information from the Southeast Florida Multiple Listing Service (SEFMLS) or from MIAMI Association of REALTORS(R) for the period 2012 through 2026. Deemed reliable but not guaranteed.
28% of homes for sale in ZIP 33185 are already under contract (under contract ÷ under contract + active listings) — a read on how much of the available inventory buyers have already claimed. Source: MLS data (2026-10-20).
Oakland Market Scorecard
Oakland is currently a balanced market., a median asking price of $549,000, and homes go under contract in about 30 days.
Go deeper: ZIP market scorecard · county scorecard · true cost calculator · affordability calculator.
Live data: MIAMI MLS, refreshed twice daily. Market metrics only; these describe homes for sale and recent sales, not residents.
The Oakland buying strategy.
If we were buying in Oakland today, this is the order of operations we would run for our clients.
Underwrite the condition first. Price the roof, HVAC, and systems honestly before judging any list price; condition swings value here more than square footage alone.
Match the home to real comps. Recent sales of similar condition and lot, not the asking price, tell you what a home is worth.
Move deliberately, not desperately. Neither side has a decisive edge, so a well-prepared, fairly-priced offer wins without overpaying.
Line up financing and inspection early. A pre-approval and an inspection plan let you act fast and negotiate from evidence.
Keep an agent in your corner. The listing agent works for the seller; we represent you and prepare a hand-built valuation before any offer in Oakland.
A Small Sample, A Clear Signal
With a closings window of just three transactions, Oakland Subdivision does not offer the depth of data you'd get in a higher-volume community, and that changes how the numbers should be used. The median price of $850,000 and per-square-foot figure of $354.31 are real trades, not estimates, but they represent what a very small group of buyers agreed to pay, not a broad market consensus. Treat them as a starting reference point for conversation, not a fixed ceiling or floor.
The market heat score of 58 sits in a moderate range, and paired with a 9-day median days on market, it suggests that when something does list, buyer interest shows up quickly. The year-over-year change of 54.5% is steep enough to flag as a genuine shift in this pocket rather than routine drift, and it reinforces that pricing conversations here need to be current, not based on what a similar home sold for a year or two ago. No community amenities are identified from current MLS listings, so value here is being set by the homes and lots themselves rather than shared features.
The location and the amenities are priced into every listing in Oakland. The deal is won or lost on condition, the comps, and the renovation math.
Why work with Momentum here
A market this thin rewards careful reading of every available data point rather than reliance on broad averages. We track the individual closings behind these numbers, not just the summary statistics, so pricing conversations for both buyers and sellers in Oakland Subdivision are grounded in what actually happened on the ground, not in assumptions that a bigger, more liquid community could support.
Oakland in 15 seconds.
Email me new listings in Oakland
One e-mail a day, only when a home lists here, with price, beds, baths and a link to every listing. Straight from the MLS feed; no account needed.
Ask an agent about Oakland
Have a question about the homes, fees, rules or commute here? A Momentum agent who works Oakland will answer, and the answer is published on this page for the next buyer.
HOA, CDD & Fees
- HOA dues reported around $70/month (about $840/yr) · median of 29 MLS listings, most billed monthly
- Any club/amenity membership is billed separately
Listings in this community report association dues of about $70 per month ($840 a year) — the median AssociationFee across 29 MLS records, normalised to a monthly figure; most are billed monthly. Dues change with budgets and can differ by section or product type; confirm the current figure with the association before you offer. Source: MLS listing records, 2026-10.
Confirm the current HOA dues, exactly what they cover, and any CDD bond or special assessment for a specific address before you offer.
Tools for a Oakland buy.
Free calculators to pressure-test the real cost before you tour.
Selling here is won on condition and pricing to real comps, not an automated estimate. The right number comes from closed Oakland sales matched to your home.
Price it to the comps and condition, not an automated estimate.
If you are thinking about selling in Oakland, the right list price comes from recent comparable sales matched to your home's condition and location, not an automated estimate.
What is your Oakland home worth?
Get a no-obligation home value based on real comparable sales in Oakland, not an automated guess. Tell us about your home and we will personally prepare your numbers and a pricing strategy. No obligation, no spam.
See all homes for sale in Miami →
Recently off market in OAKLAND SUBDIVISION
Homes in OAKLAND SUBDIVISION that recently left the market. Each address opens its public-record profile: county-recorded value, property taxes, the last recorded sale, community sales history, and what is for sale nearby now. 1 on record.
- 4450 SW 164 Ave · off market
| Location | Miami, Miami-Dade County, FL · ZIP 33185 |
|---|---|
| Sale prices, last 12 months | $850,000 median across 5 closed sales · $354 per sq ft · +54.5% vs the prior 12 months |
| Days on market (closed sales) | 9 median |
| For sale right now | 3 active, 0 pending · median asking $549,000 |
Data as of September 20, 2026. Based on information from the Southeast Florida Multiple Listing Service (SEFMLS) or from MIAMI Association of REALTORS(R) for the period 2012 through 2026. Market figures describe homes, not residents. Cite as: Momentum Realty, “Oakland key facts,” movewithmomentum.com/neighborhoods/oakland-subdivision, data as of September 20, 2026.
Just listed in Oakland
The newest homes for sale in Oakland right now, newest first. Each link opens the full listing with every photo, the price history and a tour request.
- 16588 SW 44 Street $1,200,000 · 5 bd · 4 ba · 2,731 sq ft · 18 days on market Courtesy of Florida Realty of Miami Corp
- 4420 SW 163Rd Ct $537,000 · 4 bd · 3 ba · 1,704 sq ft · 30 days on market Courtesy of VIDA International Realty
- 16335 SW 44Th Ter $535,000 · 3 bd · 3 ba · 1,476 sq ft · 36 days on market Courtesy of Xcellence
Checked against the MLS Oct 20, 2026. All new listings in this market.
Every Home for Sale in Oakland Subdivision Right Now (3)
All 3 active and pending Oakland Subdivision listings with a detail page, newest first, refreshed twice a day from the MLS.
- 16335 SW 44th Ter · $535,000 · 3 bd / 3 ba · listed Sep 16, 2026 · listed by Xcellence
- 16588 SW 44 Street · $1,200,000 · 5 bd / 4 ba · listed Aug 23, 2026 · listed by Florida Realty of Miami Corp
- 4420 SW 163rd Ct · $537,000 · 4 bd / 3 ba · listed Aug 11, 2026 · listed by VIDA International Realty
More Miami home searches
- All homes for sale in Miami, FL
- Homes for sale in Miami-Dade County, FL
- Homes under $300K in Miami
- Homes from $300K to $500K in Miami
- 4-bedroom homes for sale in Miami
- Miami home values: what is my house worth?
- ZIP 33185 housing scorecard
- 25 coming-soon communities in Miami-Dade County
Miami guides & data
Florida buyer guides
- Florida home insurance rates by county
- Florida property tax by county
- Florida property tax calculator
- What flood zone X means
- The 4-point inspection, explained
- Florida flood insurance calculator
Real estate agent in Miami? Join Momentum in Miami: 100% commission, one $12K cap.
Streets in this community
Street-level pages: every home on record, what sold and what is for sale on each street.
- SW 164Th Path (4 homes on record)
- SW 44Th Terrace (3 homes on record)
- SW 165Th Court (3 homes on record)
- SW 165 Court (2 homes on record)
- SW 164Th Path (2 homes on record)
Frequently Asked Questions
What is the median home price in Oakland?
How long do homes in Oakland take to sell?
Who is the best real estate agent for Oakland?
How do I find a top Miami real estate agent who knows Oakland?
Can Momentum Realty connect me with an agent for Oakland?
Where is Oakland, and what county is it in?
Should you buy in Oakland?
An honest fit check. We will tell you when it is not your community.
Data sources & freshness
| Live listings | MIAMI MLS, refreshed twice daily (last: October 18, 2026) |
| Community market stats | MIAMI MLS closed sales, 12-month windows ending September 20, 2026 |
| Under-contract shares | MIAMI MLS records, as of 2026-09-20 |
| Historical depth | Closed-sale records back to 2012 (58 transactions analyzed) |
Verify the primary sources yourself: Florida DOR · U.S. Census · FEMA flood maps · Citizens Property Insurance.
Momentum Research figures are our own analysis of MIAMI MLS records; MLS data is deemed reliable but not guaranteed. Methodology: how Momentum market scores are computed. Market metrics describe homes for sale and recent sales, not residents.
Own a home here?
You just read the data. Now see what your home is worth.
The numbers on this page move markets in the aggregate. The number that matters to you is what a buyer pays for your address. Momentum sells for 1.25% above the MIAMI MLS member average and 8 days faster, and we’ll price yours against live local comps.
Looking to buy here? Search homes for sale →
What’s your home worth in your area?
A real valuation with real comps from a local listing agent, not an instant algorithm. Response within one business day.
See how OAKLAND SUBDIVISION fits the bigger picture — live prices, inventory, and Momentum Scores:
More on Oakland
- Home values · What homes in Oakland actually sell for
Nearby Communities
Explore more neighborhoods near Oakland with Momentum Realty’s local guides.