
Data Analysis
Houses in west Pensacola ZIP 32506 sold in a median 26.5 days from August to October 2026, against 66 days in ZIP 32501 and 94.5 days in downtown ZIP 32502.
Our October Market Pulse ranks 18 Pensacola-area ZIPs by house sale pace: 32506 at 26.5 days, Pace 32571 at 30 on 230 sales, downtown 32502 at 94.5.
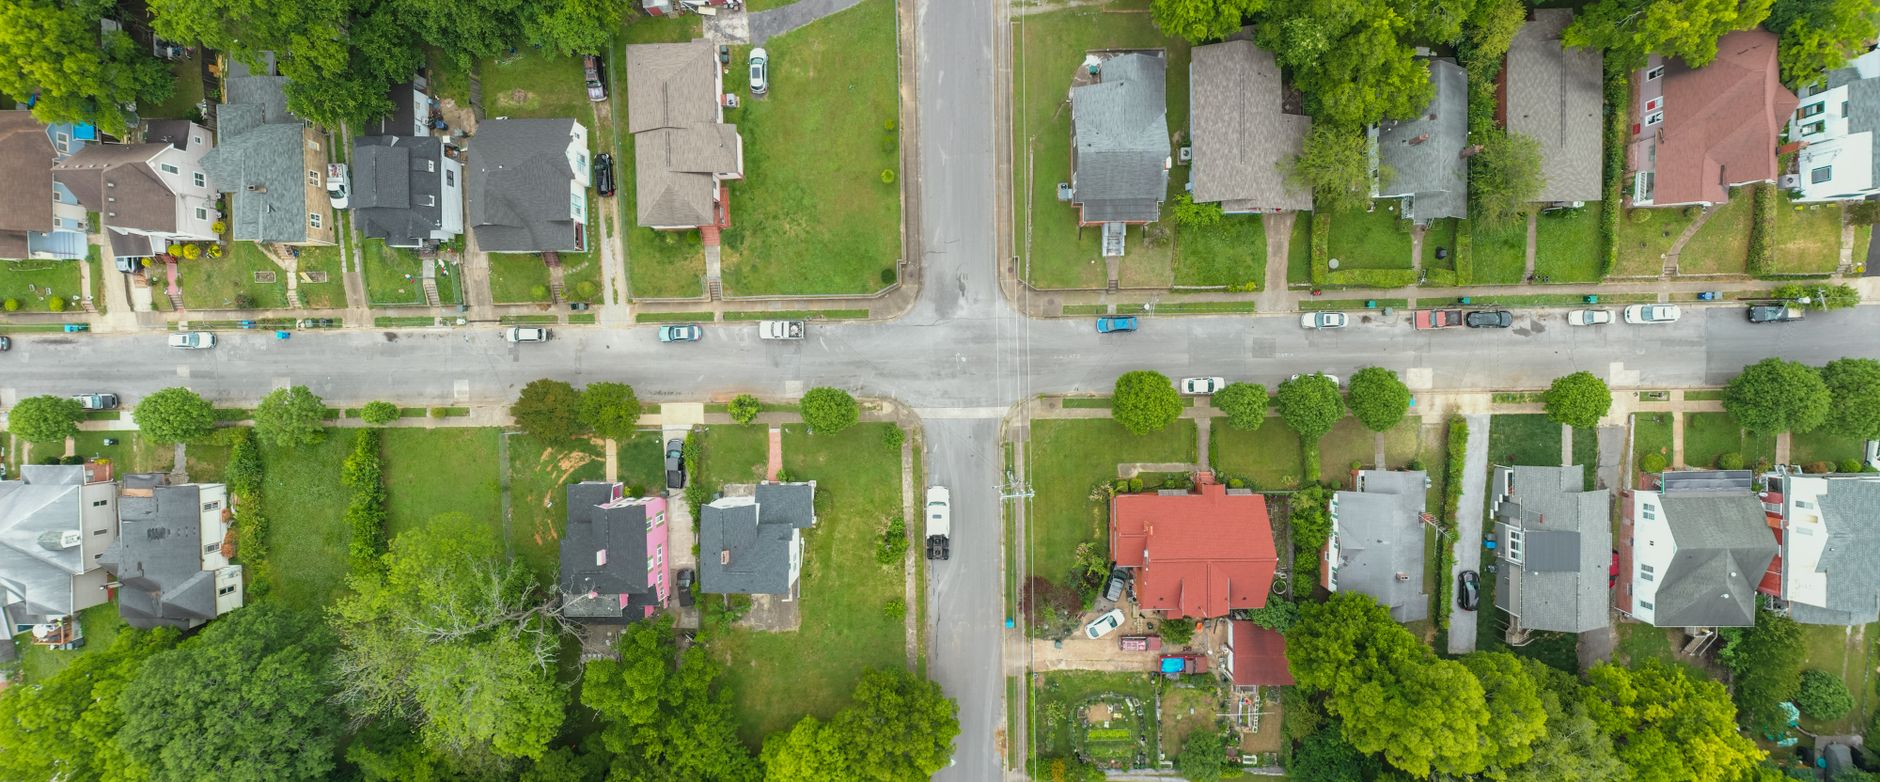
Single-family homes in Pensacola ZIP 32506 sold in a median 26.5 days from August to October 2026, the fastest of 18 ZIPs in the Pensacola MLS footprint with at least 15 house sales, according to the October edition of our Pensacola Market Pulse. ZIPs 32505 and 32534 followed at 28.5 days. At the slow end, ZIP 32501 took 66 days and downtown ZIP 32502 took 94.5. The busiest ZIP, Pace 32571, closed 230 houses at a median $353,573 in 30 days, and Milton 32570 sold 24.1% of its houses above the original list price. All figures come from the Market Pulse report, built by Momentum from Pensacola MLS records; information is deemed reliable but not guaranteed.
Monthly median price, days on market and closed sales for Escambia and Santa Rosa counties sit on the Pensacola market data hub. This article goes one level down, to how the pace of house sales differs by ZIP code.
How is the Pensacola area ZIP heat map built?
The Market Pulse heat map for the Pensacola MLS feed counts single-family closings from August through October 2026 in ZIPs with at least 15 sales. For each ZIP it reports closings, median sale price, median days on market and the share of houses that sold above their original list price. Grouped by county, 11 ZIPs lie mainly in Escambia County with 1,017 house sales over the three months, 6 lie mainly in Santa Rosa County with 820, and one, Atmore 36502 in Alabama, had 25. The 18 ZIPs together account for 1,862 sales.
Which Pensacola area ZIP codes sold fastest?
| ZIP | Place | County | Closings | Median price | Median days | Sold above original list |
|---|---|---|---|---|---|---|
| 32506 | Pensacola | Escambia | 110 | $261,833 | 26.5 | 15.5% |
| 32505 | Pensacola | Escambia | 64 | $173,500 | 28.5 | 23.4% |
| 32534 | Pensacola | Escambia | 46 | $232,500 | 28.5 | 15.2% |
| 32563 | Gulf Breeze | Santa Rosa | 133 | $400,000 | 29 | 11.3% |
| 32504 | Pensacola | Escambia | 66 | $317,500 | 29 | 9.1% |
| 32571 | Pace | Santa Rosa | 230 | $353,573 | 30 | 18.7% |
| 32570 | Milton | Santa Rosa | 141 | $299,900 | 31 | 24.1% |
| 32526 | Pensacola | Escambia | 172 | $307,450 | 32 | 15.1% |
Source: Momentum Market Pulse, Pensacola, October 2026 edition (trailing three months, single-family, ZIPs with at least 15 closings). Deemed reliable but not guaranteed.
Eight ZIPs sold houses in a median 32 days or less, and they span both counties. The four fastest Escambia ZIPs had medians between $173,500 and $317,500. In Santa Rosa, Gulf Breeze 32563, Pace 32571 and Milton 32570 all closed in about a month, and together they made up 504 of the county's 820 sales on the map. ZIP 32505 and Milton 32570 had the highest above-list shares among the larger ZIPs, at 23.4% and 24.1%.
Which Pensacola area ZIP codes sold slowest?
| ZIP | Place | County | Closings | Median price | Median days | Sold above original list |
|---|---|---|---|---|---|---|
| 32502 | Pensacola | Escambia | 26 | $442,450 | 94.5 | 7.7% |
| 32501 | Pensacola | Escambia | 40 | $330,000 | 66 | 0.0% |
| 32533 | Cantonment | Escambia | 189 | $332,000 | 56 | 11.6% |
| 36502 | Atmore, Ala. | Escambia, Ala. | 25 | $203,000 | 49 | 28.0% |
| 32583 | Milton | Santa Rosa | 201 | $319,900 | 48 | 11.4% |
| 32503 | Pensacola | Escambia | 87 | $380,000 | 42 | 8.0% |
| 32507 | Pensacola | Escambia | 126 | $309,000 | 41.5 | 7.9% |
Source: Momentum Market Pulse, Pensacola, October 2026 edition (trailing three months, single-family). Deemed reliable but not guaranteed.
The two downtown ZIPs, 32502 and 32501, were the slowest on the map, and neither is large: 66 sales between them over three months. ZIP 32501 had no house sell above its original list price. The larger slow ZIPs are Cantonment 32533 with 189 sales at 56 days and south Milton 32583 with 201 at 48 days. Our Santa Rosa new homes and builders piece covers new construction in the county.
Where do the biggest and priciest ZIPs fall?
Five ZIPs closed more than 140 houses each over the three months: Pace 32571 (230), Milton 32583 (201), Cantonment 32533 (189), Pensacola 32526 (172) and Milton 32570 (141). Their medians ranged from $299,900 to $353,573, and their pace ranged from 30 to 56 days, so ZIPs at similar prices sold at very different speeds.
At the top of the price range, Gulf Breeze 32561, which includes Pensacola Beach, had the highest median on the map at $912,500 across 30 sales, with a median 39 days and no sales above the original list price. Navarre 32566 closed 85 houses at a median $439,900 in 35 days. Our Pensacola Beach rental rules piece covers the island's rules for homes there.
How did the Pensacola market finish October?
Across the Pensacola MLS feed, October recorded 591 single-family closings at a median $324,900 and 43 days on market. The report counted 2,375 active house listings, about 3.2 months of supply, and 48.6% of active listings had cut their price at least once. The Momentum Market Score was 53 out of 100, up from 52 in September, labeled balanced, firm. By county, Escambia recorded 316 October house closings at a median 43 days and Santa Rosa 244 at 40 days.
Our same-home resale prices piece compares the median with what the same houses resold for, and the Santa Rosa contracts piece covers the contract side. Place page: Pensacola.
People also ask
Where do houses sell fastest in the Pensacola area? Pensacola ZIP 32506 had the shortest median for single-family homes, 26.5 days, from August to October 2026, followed by ZIPs 32505 and 32534 at 28.5 days, according to the Momentum Market Pulse.
How long do houses take to sell in Pace, Florida? Pace ZIP 32571 had a median 30 days on market across 230 single-family sales from August to October 2026, at a median $353,573, the most sales of any ZIP in the Pensacola MLS footprint.
Why do downtown Pensacola houses take longer to sell? The Market Pulse does not measure causes. It shows downtown ZIP 32502 at a median 94.5 days across 26 sales and ZIP 32501 at 66 days across 40, both small samples that can swing from one quarter to the next.
What share of Pensacola area listings have cut their price? In the October 2026 report, 48.6% of active single-family listings in the Pensacola MLS footprint had cut their price at least once.
Limitations
ZIP figures are trailing three months (August to October 2026), single-family homes only, for ZIPs with at least 15 closings; the October summary covers October 2026 alone. Each ZIP is grouped by the county where most of it lies, and several ZIPs cross city or county lines. Place names follow the city most often recorded in each ZIP's sales. Small ZIPs of 15 to 40 sales can swing from one quarter to the next. Above-list share compares the sale price with the original list price. Information is deemed reliable but not guaranteed.
Sources
- Momentum Market Pulse, Pensacola, October 2026 edition, Momentum Research report built from Pensacola MLS records, updated November 12, 2026; every figure in this article is quoted from that report or summed from its ZIP rows.
- Pensacola market data hub, Momentum Research.
Disclosure: Jon Brooks is a co-founder of Momentum Realty, a Florida real estate brokerage that owns and funds Florida Housing Intelligence. Momentum has a financial interest in Florida real estate transactions, including in markets named here. See our editorial standards.
Market statistics in this article are computed from MLS data licensed by Momentum Realty, and are current as of the date shown. Data may be preliminary and subject to revision by its source. This article is general information, not advice about any specific property, transaction, or financial decision, and is not a representation about any specific property, community, builder, or association.
Equal Housing Opportunity. Editorial standards · Corrections · About