

Montclair
Homes for Sale in Orange Park, FL
All 331 homes for sale in Orange Park, FL · median $330,000 · 150 homes for sale in 32073 · Clay County homes for sale
True comps, carrying-cost math, and listings before the portals.
Market Heat
Photo via realMLS
As of November 2026, Montclair in Orange Park, FL has 1 home for sale. Over the 12 months ending 2026-11-12, 7 recorded sales closed at a median of $325,000, $198 per square foot, a median 50 days on market, sellers accepting 95% of original asking. Homes listed or recently sold were built 1973–1978; 4 listings state no HOA; none of the 9 geocoded homes sit in a FEMA special flood hazard zone (median elevation 25 ft). At the median price and Clay County's FY2025-26 rate of 15.05 mills, annual property tax runs about $4,890 ($4,300 with the full homestead exemption).
Last 30 days in Montclair: 1 new listing (median asking $349,000), 3 under contract right now. As of November 12, 2026, realMLS.

Montclair is an older Orange Park pocket where the housing stock spans decades, from the 1940s through 2014, with a median build year of 1973. That age spread is the real story on price: at a median of $325,000 and roughly $198 per square foot, what you pay here tracks condition and updating more than location. Two homes on the same street can sit far apart in value depending on whether the systems, kitchens, and baths have been touched. There is no tidy price band to quote — the spread is wide and driven by the work already done or still waiting.
The current posture favors the patient buyer. Prices are down 7.1% year over year, the median home takes about 44 days to sell, and the heat score of 32 points to a slow, negotiable market. Sellers should price to the condition of the home honestly and expect to wait past a month; the days of instant offers are not the reality here right now. For buyers, that means room to inspect, negotiate, and walk away.
Figures in this note are as of July 12, 2026. The live market numbers elsewhere on this page update nightly and are newer.
Montclair right now
🟡 Balanced market. 1.7 months of supply and 75% of the inventory already under contract put buyers and sellers on roughly even footing.Why it matters: months of supply is how long today's inventory would last at today's sales pace; under-contract share is the portion of homes for sale that already have a buyer.Momentum Research analysis of realMLS records, as of November 12, 2026. Confidence: Medium (4 active and pending listings, 7 closed sales in 12 months).
🟡 Off the recent peak. The trailing-12-month median ($325K) is down 7.5% from the prior 12 months ($352K) and up 176% since 2012. With about a dozen sales a year, a single closing can swing this number, so read the level and the decade, not one year's move.Momentum Research, record-level realMLS closed sales, 12-month windows ending November 12. Confidence: Medium (7 and 8 sales in the two windows).
Jump to: Price history & scorecard · Homes for sale · Schools · FAQ
· Updated November 13, 2026 · Live data: realMLS, refreshed twice daily · MLS facts carry their source; interpretation lines are Momentum Research · Data sources & freshness
The 60-Second Overview
Montclair market snapshot (as of November 12, 2026): the median sale price is about $325K ($198 per sq ft over the trailing 12 months of closed sales), a median 50 days on market for closed sales, and 1.7 months of supply, a balanced market. The trailing-12-month median is down 8% from the prior 12 months and up 176% since 2012, computed from record-level realMLS closed sales (7 closings in the current window).
In ZIP 32073 (Orange Park), 943 homes closed in the last 12 months at a median of $302K ($172/sq ft), down 1.9% year over year, with a median 36 days on market. Right now 180 active and 77 pending listings put supply at about 2.3 months — a healthy market. See the live ZIP 32073 housing market and the Clay County market.
County records show 6 qualified sales in Montclair across 2024–2025 (3 in 2024, 3 in 2025), median $358,100 — the last recorded sale per parcel on the Florida DOR 2025 assessment roll, independent of the MLS.
Flood zones in Montclair: of 8 listing addresses checked against the FEMA National Flood Hazard Layer, 100% sit outside the FEMA Special Flood Hazard Area (Zone X). Individual parcels vary - verify any specific address at msc.fema.gov. See flood zones by neighborhood in Orange Park.
Montclair is a community of 91 homes in Orange Park, Clay County, built between 1973 and 1978 (median 1974), with a median living area of about 1,721 square feet. 75% of parcels are homesteaded, the owner-occupancy proxy in the Florida DOR assessment roll (2025 roll, public records).
Montclair is an established neighborhood in Orange Park with a small, steady sales pace and homes that reward a close look at condition. With about 74% of homes owner-occupied, turnover is modest and inventory moves at a measured clip.
The setting & the homes.
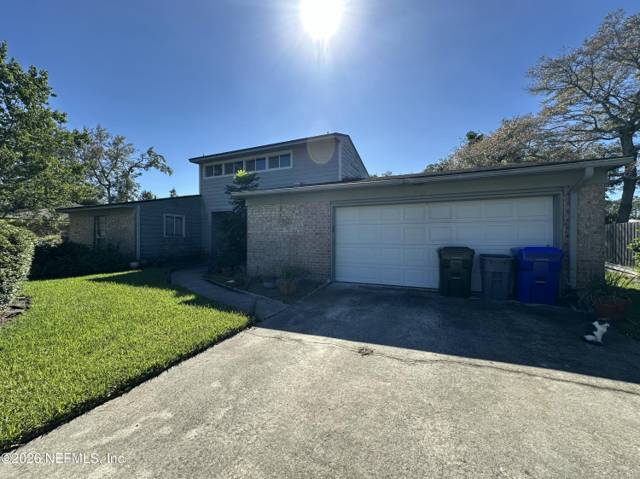
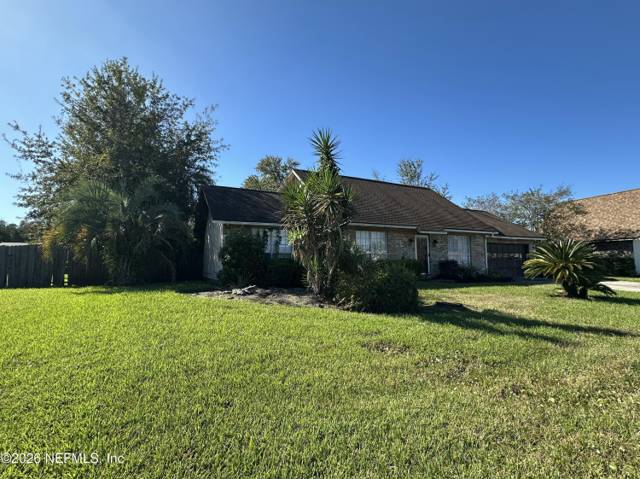
Aerial and on-site photos of Montclair. Swipe to explore the community.
Swipe or use the arrows → tap any photo to enlarge
Montclair Montclair
 Montclair
 Montclair
 Montclair
 Montclair
 Montclair
 Montclair
Photos from realMLS listings in Montclair; content deemed reliable but not guaranteed.
Who Montclair is best for.
Best for
- Long-hold buyers who value an established neighborhood and a modest, single-story footprint around 1,682 square feet
- Renovation-minded buyers with a budget for updating older systems in exchange for a lower entry point
- Buyers who want negotiating leverage in a slow market and time to do proper due diligence
Probably not for
- Buyers who need a fully turnkey, new-construction home with no deferred maintenance
- Short-term buyers counting on quick resale in a market currently down year over year
- Buyers who want a large-square-footage or higher-end footprint than this neighborhood typically offers
Price History: What Homes Here Have Actually Sold For
Median sale price over the trailing 12 months ending November 12 of each year, from record-level realMLS closed sales. Same methodology as every appreciation figure on this page: the 2026 point ($325K) IS the median in the snapshot above, and the move from 2025 ($352K) IS the -7.5% one-year change.
Windows contain 6 to 16 sales each (7 in the current window); every figure carries its sample size, and thin markets swing on single closings. Source: Data provided by realMLS. Deemed reliable but not guaranteed.
24% of homes for sale in ZIP 32073 are already under contract (under contract ÷ under contract + active listings) — a read on how much of the available inventory buyers have already claimed. Source: MLS data (2026-11-13).
Montclair Market Scorecard
Montclair is currently a balanced market. About 1.7 months of supply, a median asking price of $349,000, and homes go under contract in about 7 days.
Go deeper: ZIP market scorecard · county scorecard · true cost calculator · affordability calculator.
Live data: realMLS, refreshed twice daily. Market metrics only; these describe homes for sale and recent sales, not residents.
Homes For Sale Right Now in Montclair
Live MLS inventory for Montclair. Every active listing, what is under contract right now, and the last 12 months of closed sales, refreshed twice a day. Closed comps beat an algorithm's guess every time.
Active · 7 daysTop listingUnder Contract · 42 daysUnder Contract · 22 daysUnder Contract · 22 daysActive and pending Montclair listings as of 2026-11-12, priced high to low. Source: Data provided by realMLS. Tap any home to ask about it.
Montclair on the map.
Every active, pending, and recently sold home, plotted. Toggle the layers and tap a home for the details.
Listing locations from realMLS. Map data © OpenStreetMap contributors.
Schools
- Clay County Public Schools
- Verify the zoned schools by address
- Magnet and choice options may be available
- Montclair · Elementary
- Lakeside · Middle
- Orange Park · High
Zoned schools reflect the assignments reported on recent Montclair listings and can change; always confirm with Clay County Public Schools for a specific address.
Buying with schools in mind? We can confirm the exact zoned schools for any Montclair address.
The Montclair buying strategy.
If we were buying in Montclair today, this is the order of operations we would run for our clients.
Underwrite the condition first. Price the roof, HVAC, and systems honestly before judging any list price; condition swings value here more than square footage alone.
Match the home to real comps. Recent sales of similar condition and lot, not the asking price, tell you what a home is worth.
Move deliberately, not desperately. Neither side has a decisive edge, so a well-prepared, fairly-priced offer wins without overpaying.
Line up financing and inspection early. A pre-approval and an inspection plan let you act fast and negotiate from evidence.
Keep an agent in your corner. The listing agent works for the seller; we represent you and prepare a hand-built valuation before any offer in Montclair.
Age, condition, and the long view
The defining feature here is the housing stock itself. With a median year built of 1973 and a range reaching back to 1940, Montclair is a renovation-sensitive market. A median living area of about 1,682 square feet keeps most homes in a manageable, single-family footprint, but the value inside that footprint hinges almost entirely on updates. Buyers should budget for inspection and, in many cases, for modernizing systems that are original to the home.
Zoom out and the long-term trend is worth noting: values are up 152% since 2012, even with the recent 7.1% pullback over the past year. That combination — long appreciation, a current soft patch, and a high owner-occupancy share near 74% — describes a neighborhood people tend to stay in rather than flip. The near-term softness is a negotiating window, not a structural weakness.
The location and the amenities are priced into every listing in Montclair. The deal is won or lost on condition, the comps, and the renovation math.
Momentum Buy Score.
Our proprietary 0 to 10 read across the factors that decide how a home in Montclair buys, holds, and resells. Momentum Research; not an appraisal.
Momentum Intelligence Scores are our proprietary, qualitative assessment on a 0 to 10 scale, built from the record-level market data on this page. They are a framework for comparing communities, not a guarantee of future value and not advice on a specific home; unlike an automated value estimate they do not price your home, they grade the community on evidence you can inspect. Composite is the plain average of the 5 factors (7.3). Basis: Long-Term Appreciation +176% since 2012; Recent Direction -7.5% year-over-year; Liquidity & Demand 1.7 months of supply; Owner Commitment 75% owner-occupied; Pricing Power 95.0% sale-to-list. Refreshed with each data update.
Why work with Momentum here
In a condition-driven market like Montclair, the difference between a fair price and an overpay is what you know about the house before you write the offer. We read each home on its own merits — age of systems, quality of updates, comparable closings within the neighborhood — rather than leaning on a blanket per-foot number. With the market soft and days on market running around 44, we have room to negotiate on your behalf, and we will tell you plainly when a listing is priced for its dreams instead of its condition.
Montclair in 15 seconds.
Tools for a Montclair buy.
Free calculators to pressure-test the real cost before you tour.
Selling here is won on condition and pricing to real comps, not an automated estimate. The right number comes from closed Montclair sales matched to your home.
Price it to the comps and condition, not an automated estimate.
If you are thinking about selling in Montclair, the right list price comes from recent comparable sales matched to your home's condition and location, not an automated estimate.
What is your Montclair home worth?
Get a no-obligation home value based on real comparable sales in Montclair, not an automated guess. Tell us about your home and we will personally prepare your numbers and a pricing strategy. No obligation, no spam.
See all homes for sale in Orange Park →
Housing distress & ownership in Montclair, Orange Park
Who owns here, how much is not owner-occupied, and how much for-sale inventory is under distress.
Source: Momentum Realty Research. Ownership & parcels from the FL DOR 2025 tax roll; distress from MLS active-listing status/remarks; price from MLS closed sales. Source: Data provided by realMLS. Deemed reliable but not guaranteed.
Every Home for Sale in Montclair Orange Park Right Now (4)
All 4 active and pending Montclair Orange Park listings with a detail page, newest first, refreshed twice a day from the MLS.
- 1353 Crosby Lane · $349,000 · 4 bd / 2 ba · listed Nov 6, 2026 · listed by Island Realty, Inc.
- 2232 Gabriel Drive · $185,000 · 3 bd / 2 ba · pending · listed by Momentum Realty
- 2208 Gabriel Drive · $195,000 · 3 bd / 2 ba · pending · listed by Momentum Realty
- 2248 Gabriel Drive · $324,900 · 3 bd / 2 ba · pending · listed Oct 2, 2026 · listed by Assist2Sell Buyers & Sellers Realty
Recently sold in Montclair Orange Park
- 1445 Marcia Drive · sold $390,000
- 1474 Betty Court · sold $325,000
- 1331 Crosby Lane · sold $351,350
- 2359 Sandy Court · sold $250,000
- 2228 Marcia Court · sold $356,000
Closed sales from the MLS; each page shows the sold price, taxes and value history.
More Orange Park home searches
- All homes for sale in Orange Park, FL
- Homes for sale in Clay County, FL
- Orange Park golf course homes
- Orange Park home values: what is my house worth?
Orange Park guides & data
- Market data
- Cost of living
- Best neighborhoods
- Flood zones
- Property taxes (Clay County)
- Homestead exemption (Clay County)
- Home insurance cost
- New construction
Florida buyer guides
- Florida home insurance rates by county
- Florida property tax by county
- Florida property tax calculator
- What flood zone X means
- The 4-point inspection, explained
- Florida flood insurance calculator
- Florida housing market map
- Interactive housing market map (county, ZIP and community)
- Save Our Homes tax estimator
- How to stop a foreclosure in Florida
- Florida documentary stamp tax, explained
- Cheapest places to live in Florida
Real estate agent in Orange Park? Join Momentum in Orange Park: 100% commission, one $12K cap.
Streets in this community
Street-level pages: every home on record, what sold and what is for sale on each street.
- Moody Avenue (4 homes on record)
Email me new listings in Montclair
One e-mail a day, only when a home lists here, with price, beds, baths and a link to every listing. Straight from the MLS feed; no account needed.
Ask an agent about Montclair
Have a question about the homes, fees, rules or commute here? A Momentum agent who works Montclair will answer, and the answer is published on this page for the next buyer.
Frequently Asked Questions
What is the median home price in Montclair?
How long do homes in Montclair take to sell?
Is Montclair a buyer's or seller's market right now?
How many homes are in Montclair?
What share of Montclair is owner-occupied?
When were the homes in Montclair built?
Have Montclair home prices gone up?
Who is the best real estate agent for Montclair?
How do I find a top Orange Park real estate agent who knows Montclair?
Can Momentum Realty connect me with an agent for Montclair?
Where is Montclair, and what county is it in?
How far is Montclair from downtown Jacksonville and the beach?
Is Montclair a good place to live?
Should you buy in Montclair?
An honest fit check. We will tell you when it is not your community.
Data sources & freshness
| Live listings | realMLS, refreshed twice daily (last: November 12, 2026) |
| Community market stats | realMLS closed sales, 12-month windows ending November 12, 2026 |
| Housing stock & ownership | Florida DOR assessment roll (street-list match (3 streets, ZIP 32073)) |
| Under-contract shares | realMLS records, as of 2026-11-12 |
| Historical depth | Closed-sale records back to 2011 (156 transactions analyzed) |
Verify the primary sources yourself: Florida DOR · U.S. Census · FEMA flood maps · Citizens Property Insurance.
Momentum Research figures are our own analysis of realMLS records; MLS data is deemed reliable but not guaranteed. Methodology: how Momentum market scores are computed. Market metrics describe homes for sale and recent sales, not residents.
Own a home here?
You just read the data. Now see what your home is worth.
The numbers on this page move markets in the aggregate. The number that matters to you is what a buyer pays for your address. Momentum listings in Northeast Florida sold at 99.1% of final list price vs. 98.6% for the market, in a median 31 days vs. 41 (realMLS, 12 months to Nov 2026). A Momentum agent can price yours against live local comps.
Looking to buy here? Search homes for sale →
What’s your home worth in your area?
A real valuation with real comps from a local listing agent, not an instant algorithm. Response within one business day.
See how Montclair fits the bigger picture — live prices, inventory, and Momentum Scores: