

Bridgewater
Homes for Sale in St. Augustine, FL
All 1,076 homes for sale in St. Augustine, FL · median $479,250 · 163 townhomes for sale in St. Augustine · St. Johns County homes for sale
True comps, carrying-cost math, and listings before the portals.
As of September 2026, Bridgewater in St. Augustine, FL has 20 homes for sale and 1 pending, asking from $256,000 to $390,000 (median $329,994). Over the 12 months ending 2026-08-10, 89 recorded sales closed at a median of $316,990, $217 per square foot, a median 56 days on market, sellers accepting 96% of original asking (+1% versus the prior year). Homes listed or recently sold were built 2022–2026 with 8 new construction; none of the 33 geocoded homes sit in a FEMA special flood hazard zone (median elevation 24 ft). At the median price and St. Johns County's FY2025-26 rate of 13.47 mills, annual property tax runs about $4,270 ($3,750 with the full homestead exemption).
Homes For Sale Right Now in Bridgewater
Live MLS inventory for Bridgewater. Every active listing, what is under contract right now, and the last 12 months of closed sales, refreshed twice a day. Closed comps beat an algorithm's guess every time.
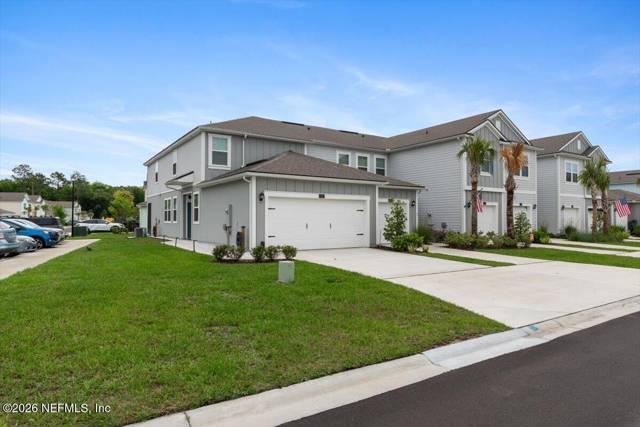 Active · 23 daysTop listing
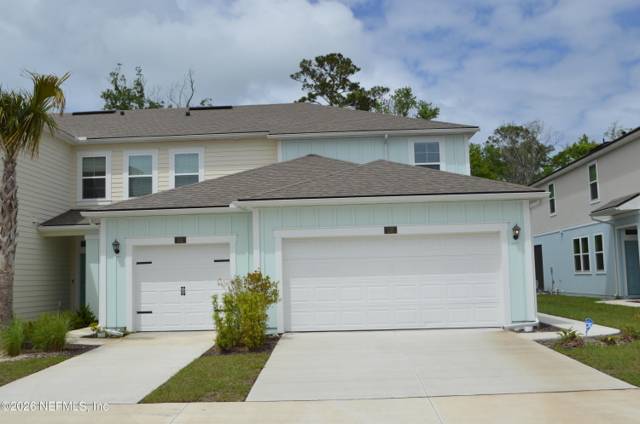 Active · 53 days
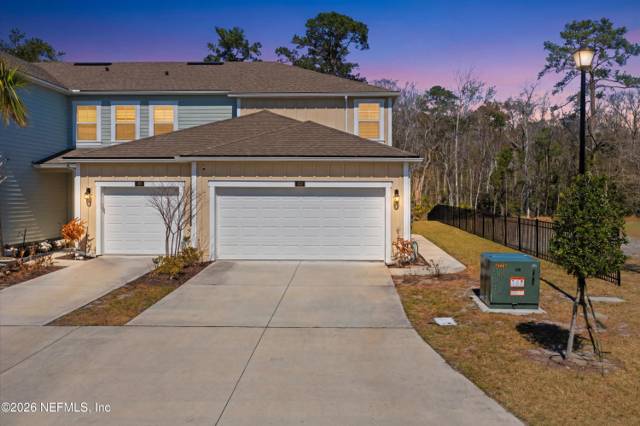 Active · 103 days
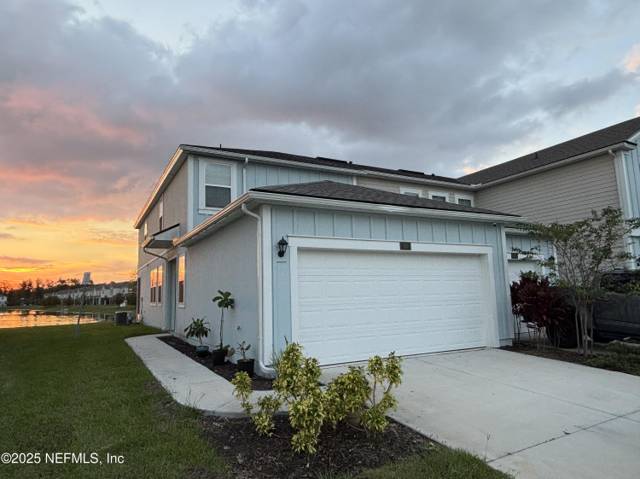 Active · 226 days
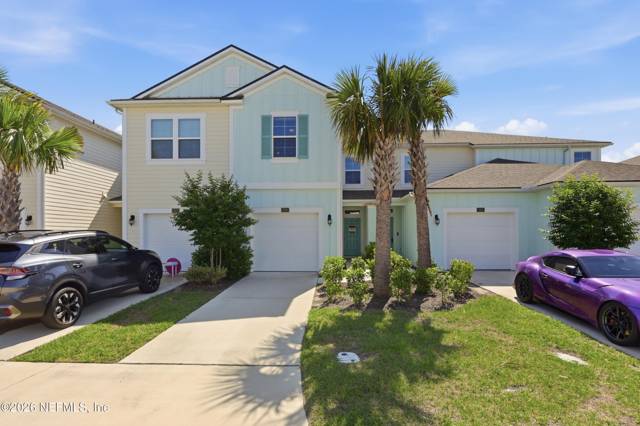 Active · 51 days
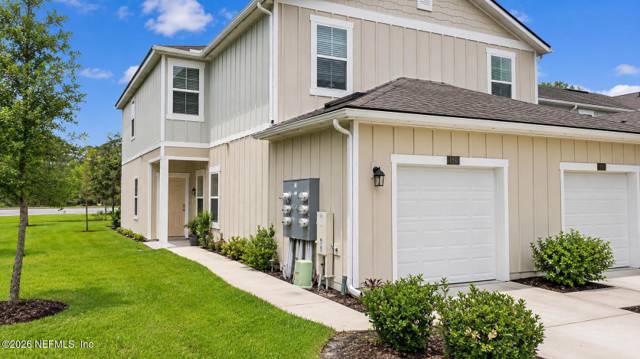 Active · 11 days
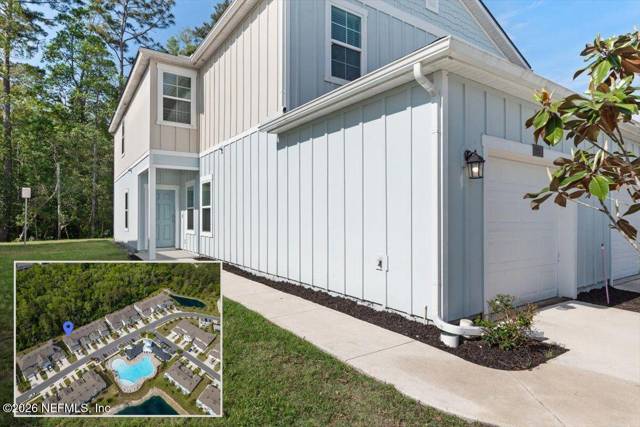 Active · 43 days
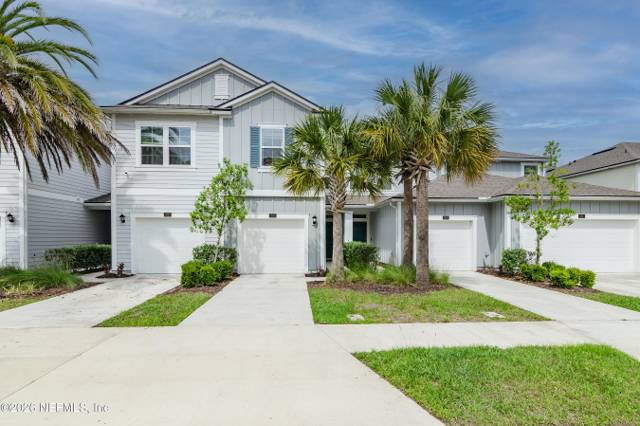 Active · 36 days
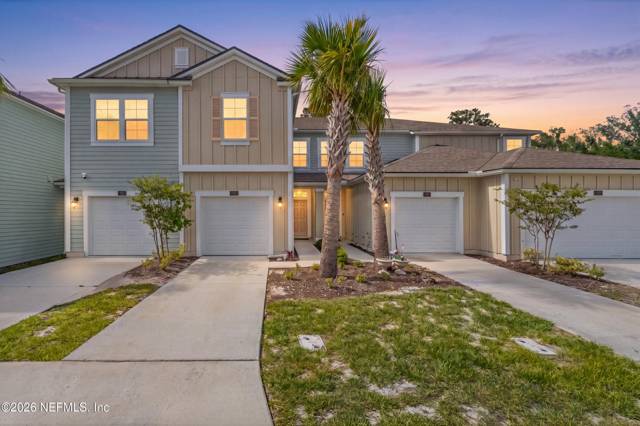 Active · 24 days
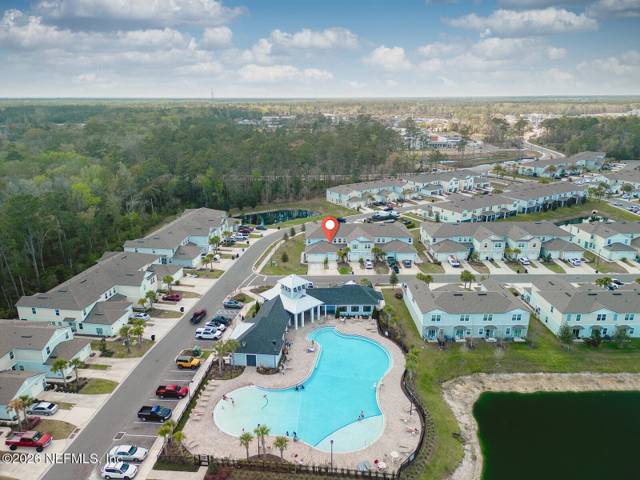 Active · 97 days
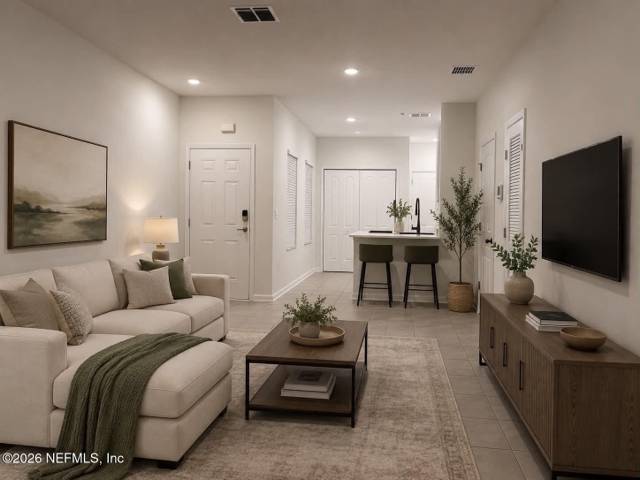 Active · 1 days
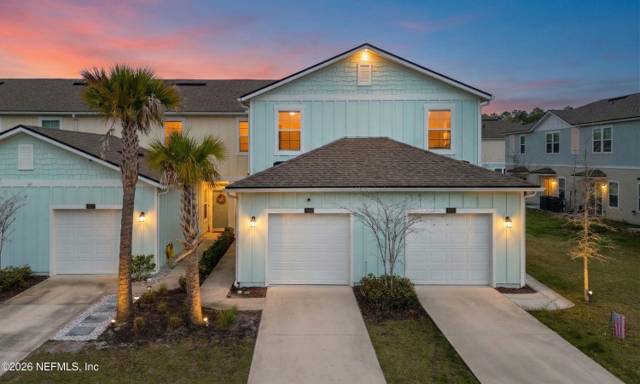 Active · 100 days
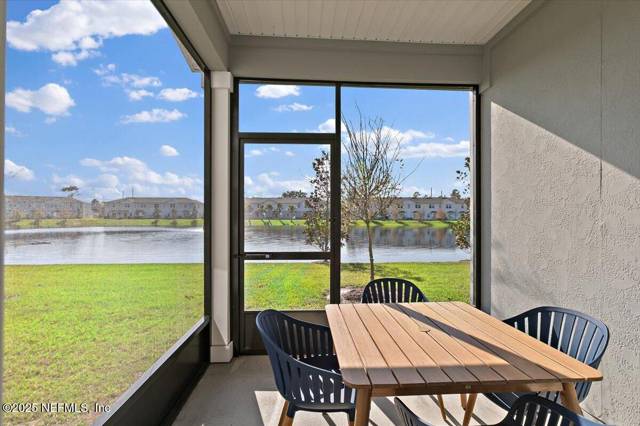 Active · 199 days
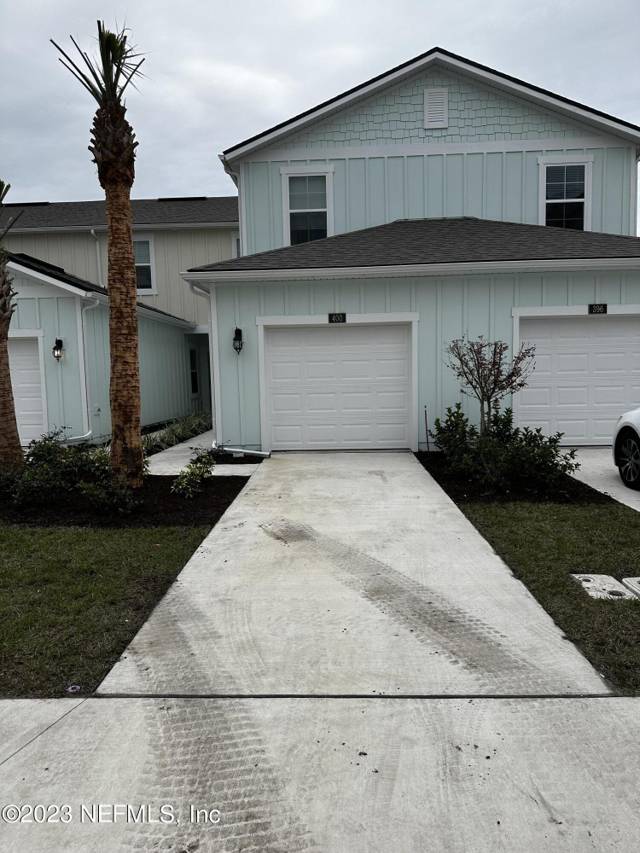 Active · 67 days
Active and pending Bridgewater listings as of 2026-06-13, priced high to low. Source: Data provided by realMLS. Tap any home to ask about it.
Bridgewater right now
🔴 Seller-leaning market. 2.2 months of supply and 5% of the inventory already under contract give sellers the pressure advantage.Why it matters: months of supply is how long today's inventory would last at today's sales pace; under-contract share is the portion of homes for sale that already have a buyer.Momentum Research analysis of realMLS records, as of August 10, 2026. Confidence: Very High (21 active and pending listings, 89 closed sales in 12 months).
🟡 Still climbing. The trailing-12-month median ($317K) is up 0.6% from the prior 12 months ($315K).Momentum Research, record-level realMLS closed sales, 12-month windows ending August 10. Confidence: Very High (89 and 180 sales in the two windows).
Jump to: Price history & scorecard · Homes for sale · Schools · FAQ
· Updated September 15, 2026 · Live data: realMLS, refreshed twice daily · MLS facts carry their source; interpretation lines are Momentum Research · Data sources & freshness
The 60-Second Overview
Bridgewater market snapshot (as of August 10, 2026): the median sale price is about $317K ($217 per sq ft over the trailing 12 months of closed sales), a median 56 days on market for closed sales, and 2.2 months of supply, a seller-leaning market. The trailing-12-month median is up 1% from the prior 12 months, computed from record-level realMLS closed sales (89 closings in the current window).
In ZIP 32082 (St. Augustine), 889 homes closed in the last 12 months at a median of $745K ($362/sq ft), up 1.3% year over year, with a median 48 days on market. Right now 202 active and 59 pending listings put supply at about 3.5 months — a balanced market. See the live ZIP 32082 housing market and the St. Johns County market.
realMLS (Northeast Florida) sales records identify 557 homes in Bridgewater that have changed hands since 2008, built between 1987 and 2026 (median 2023), with a median living area of about 1,502 sq ft and a typical 3-bedroom, 2.5-bath layout; 98% are townhomes. Source: realMLS (Northeast Florida) closed-sale history compiled by Momentum Research; counts reflect homes with a recorded MLS sale, not every home in the community.
Flood zones in Bridgewater: of 32 listing addresses checked against the FEMA National Flood Hazard Layer, 100% sit outside the FEMA Special Flood Hazard Area (Zone X). Individual parcels vary — verify any specific address at msc.fema.gov. See flood zones by neighborhood in St. Augustine.
The setting & the homes.
Aerial and on-site photos of Bridgewater. Swipe to explore the community.
Swipe or use the arrows → tap any photo to enlarge
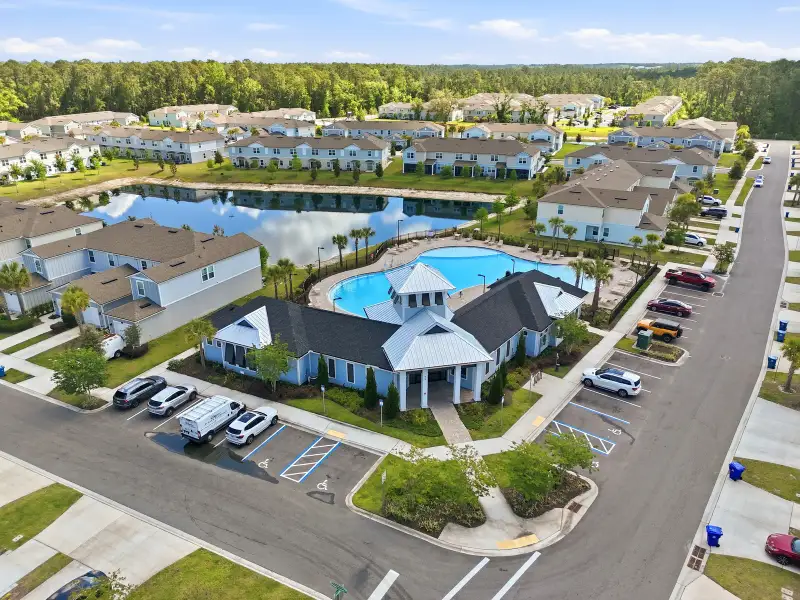 Bridgewater
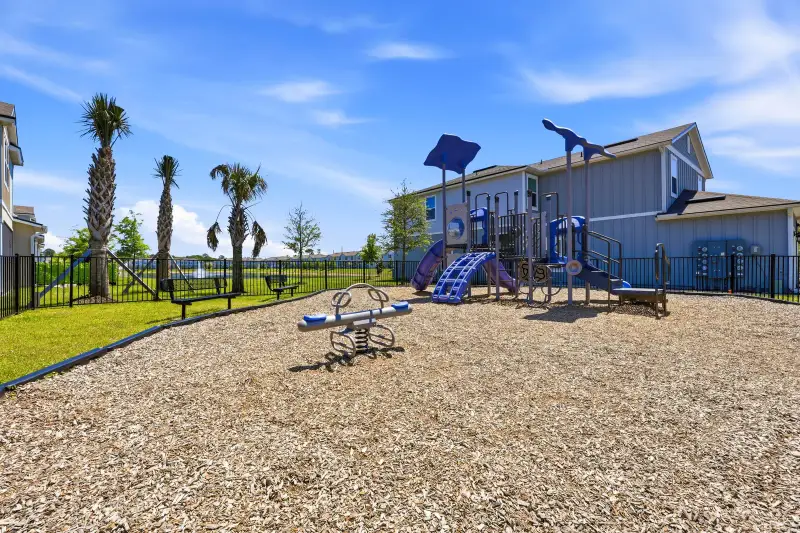 Bridgewater
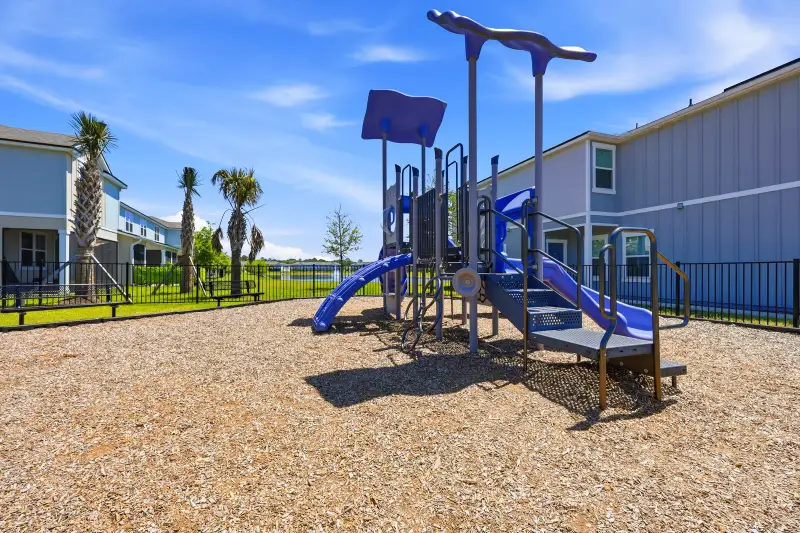 Bridgewater
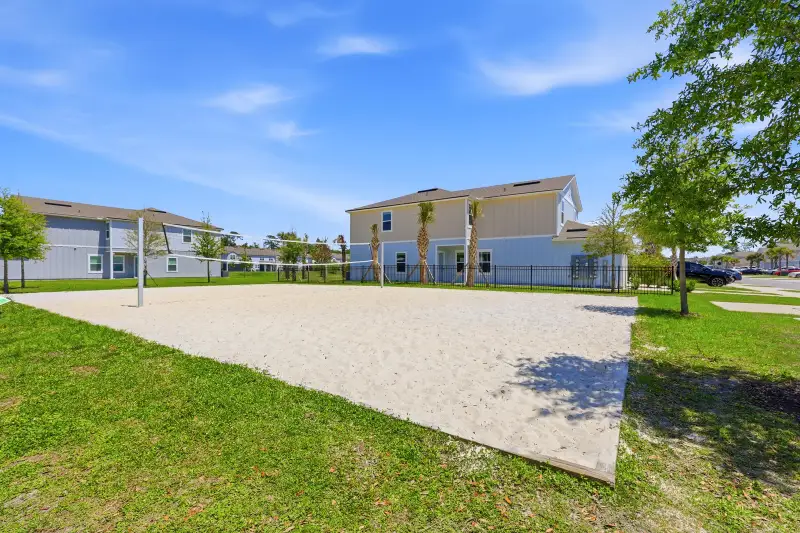 Bridgewater
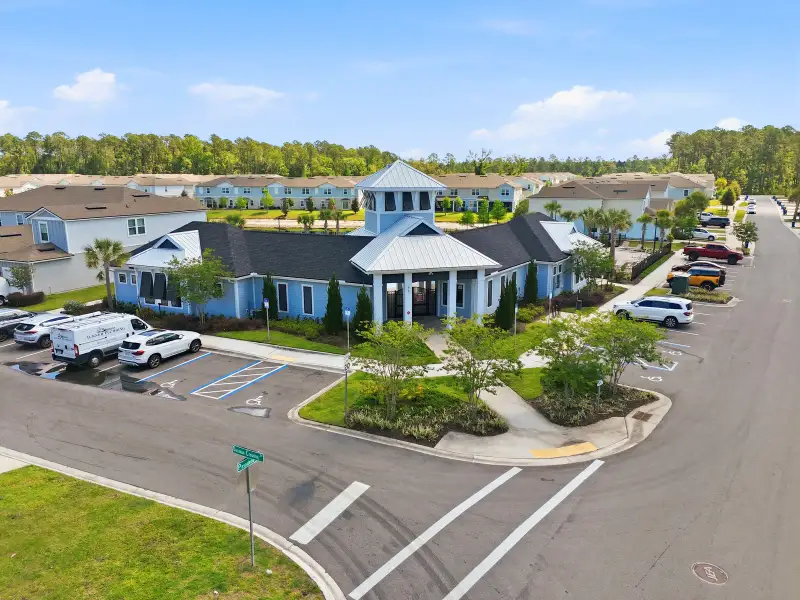 Bridgewater
Price History: What Homes Here Have Actually Sold For
Median sale price over the trailing 12 months ending August 10 of each year, from record-level realMLS closed sales. Same methodology as every appreciation figure on this page: the 2026 point ($317K) IS the median in the snapshot above, and the move from 2025 ($315K) IS the +0.6% one-year change.
Windows contain 0 to 198 sales each (89 in the current window); every figure carries its sample size. Source: Data provided by realMLS. Deemed reliable but not guaranteed.
The real cost & risk here
Before the list price, the Florida math the portals skip. These are St. Johns County typicals — your exact home, flood zone, and insurance quote will vary, so verify each before you offer.
Check it for your address: look up your flood zone (FEMA) · insurance by county · true-cost calculator · St. Johns County scorecard.
County typicals from Momentum’s Florida housing data (Zillow & Realtor.com aggregates, Census, FRED), updated monthly; insurance modeled. Flood zone is property-specific — always confirm via FEMA.
Bridgewater Market Scorecard
Bridgewater is currently a strong seller's market. About 2.2 months of supply, a median asking price of $329,994, and homes go under contract in about 47 days.
Typical home value in the 32095 ZIP is $502,106, about 19.2% below the Florida norm (Zillow Home Value Index).
Go deeper: ZIP market scorecard · county scorecard · true cost calculator · affordability calculator.
Live data: realMLS, refreshed twice daily. Typical value: Zillow Research. Market metrics only; these describe homes for sale and recent sales, not residents.
Housing distress & ownership in Bridgewater, St. Augustine
Who owns here, how much is not owner-occupied, and how much for-sale inventory is under distress.
Source: Momentum Realty Research. Ownership & parcels from the FL DOR 2025 tax roll; distress from MLS active-listing status/remarks; price from MLS closed sales. Source: Data provided by realMLS. Deemed reliable but not guaranteed.
Bridgewater on the map.
Every active, pending, and recently sold home, plotted. Toggle the layers and tap a home for the details.
Listing locations from realMLS. Map data © OpenStreetMap contributors.
How far is everything?
Everyday stops around Bridgewater are close: the nearest coffee is about 2 minutes away.
- Panera Bread · Coffee2 min
- Beachwalk Market · Groceries3 min
- ZENSHI Handcrafted Sushi · Dining3 min
- Shoppes at Beachwalk · Shopping3 min
- AQUAFIN Swim School - Ponte Vedra · Parks5 min
- Steven A. Khalil, MD · Health7 min
Approximate drive times via Mapbox Search + Directions, 2026-07-03. Verify for a specific address.
Nearby Communities
Explore more neighborhoods near Bridgewater with Momentum Realty’s local guides.
Schools
- St. Johns County Public Schools
- Verify the zoned schools by address
- Magnet and choice options may be available
- Mill Creek AcademyFLDOE grade A · Public K-8
- Tocoi Creek High SchoolFLDOE grade A · Public High
Grades are official Florida Department of Education school grades for 2025-26. Assignments are reported as of the 2025-26 year and can change; always confirm with St. Johns County Public Schools for a specific address.
Buying with schools in mind? We can confirm the exact zoned schools for any Bridgewater address.
Recent Developments in Bridgewater St Johns
Development, infrastructure, retail, and school activity affecting Bridgewater St Johns, tracked by our team and summarized from public reporting and official sources, with links to the original coverage. Last updated August 2026.
- July 2026Development
Culinary Institute of America selects Jacksonville for Southeast campus
News4Jax reported that the Culinary Institute of America chose downtown Jacksonville for its Southeast hub, to be located at 330 E. Bay Street on the Northbank riverfront. The campus would anchor a $160.5 million hotel and convention center development. The city previously approved up to $35 million in incentives, and the Downtown Investment Authority is finalizing agreements on design and property details.
What it may mean for the marketAnchors a major downtown riverfront redevelopment that pairs an educational campus with hotel and convention space, adding institutional and commercial investment to the urban core alongside Riverfront Plaza and Pearl Square. The site is about 3 miles northwest of Bridgewater St Johns.
Source: News4Jax - June 2026Infrastructure
First Coast Expressway advances as an economic-development corridor across Clay and St. Johns
The First Coast Expressway (State Road 23), a tolled beltway looping around the west and south of the Jacksonville metro, continued to open land for development along its corridor, with the final St. Johns County phase from Interstate 95 to east of County Road 2209 in progress. FDOT held a St. Johns County open house on the final phase in January 2026.
What it may mean for the marketNew limited-access highway capacity shortens commutes and opens adjacent land, changes that have historically shaped where new communities and demand concentrate. The site is about 19 miles south of Bridgewater St Johns.
Source: Jax Daily Record - May 2026Retail & Dining
Grocery-anchored retail center proposed in Durbin Park
A grocery-anchored retail center was proposed at Durbin Park, the large mixed-use development near Interstate 95 and County Road 210 in northern St. Johns County, adding to the district's existing stores, restaurants, and Walmart-anchored core.
What it may mean for the marketAdded grocery and retail at Durbin Park deepens everyday conveniences in northern St. Johns County, an amenity factor that can support demand for surrounding communities. The project is about 15 miles southeast of Bridgewater St Johns, elsewhere in St. Johns County.
Source: Jax Daily Record - April 2026Development
Southeast Toyota opens $170M vehicle-processing facility at JAXPORT's Blount Island, adding 400-plus jobs
Southeast Toyota Distributors dedicated a new vehicle processing facility at JAXPORT's Blount Island Marine Terminal in April 2026. The company put the investment at $170 million and said the facility created more than 400 full-time jobs, most of them hired locally.
What it may mean for the marketA large new employment center on Blount Island adds sustained local job demand, a factor that has historically supported nearby housing absorption. The site is about 9 miles northeast of Bridgewater St Johns.
Source: JAXPORT - February 2026Infrastructure
JAXPORT details $250M Blount Island modernization and record cargo in 2026 State of the Ports
At its February 2026 State of the Ports address, JAXPORT outlined a $250 million modernization of Blount Island's container and vehicle-handling capabilities and reported record fiscal-2025 cargo volumes. The port also said an air-draft expansion to accommodate larger ships is on track to finish by the end of 2026.
What it may mean for the marketContinued heavy investment in the Blount Island port complex anchors long-term industrial employment on the northeast side, a structural demand driver for the surrounding area. The site is about 9 miles northeast of Bridgewater St Johns.
Source: News4Jax - February 2026Retail & Dining
Durbin Park Walmart plans an expansion
The Walmart anchoring Durbin Park filed plans to expand in early 2026, reinforcing the retail core of the Interstate 95 and County Road 210 district in northern St. Johns County.
What it may mean for the marketInvestment in Durbin Park's retail anchor signals continued commercial strength in northern St. Johns County, which can reinforce the appeal of nearby residential areas. The project is about 15 miles southeast of Bridgewater St Johns, elsewhere in St. Johns County.
Source: Jax Daily Record
Summaries reflect public reporting and official sources linked above as of the dates shown. Project details, timelines, and approvals can change. Commentary on potential market effects is general observation, not investment advice or a prediction for any specific property. For the freshest items across the whole region, see This Week in Northeast Florida.
The Bridgewater buying strategy.
If we were buying in Bridgewater today, this is the order of operations we would run for our clients.
Underwrite the condition first. Price the roof, HVAC, and systems honestly before judging any list price; condition swings value here more than square footage alone.
Match the home to real comps. Recent sales of similar condition and lot, not the asking price, tell you what a home is worth.
Come strong and clean. Homes here move, so lead with your best terms and financing ready rather than a low anchor.
Line up financing and inspection early. A pre-approval and an inspection plan let you act fast and negotiate from evidence.
Keep an agent in your corner. The listing agent works for the seller; we represent you and prepare a hand-built valuation before any offer in Bridgewater.
A closer look at the Bridgewater market
At a median of $217 per square foot, Bridgewater prices sit in a fairly defined band, so condition and updates — more than the list price — tend to separate one home from the next.
Inventory runs at 2.2 months of supply, a seller-leaning market and the trailing-12-month median up 1% year over year. Homes that do trade take a median 56 days on market, useful leverage on any listing that has lingered.
The location and the amenities are priced into every listing in Bridgewater. The deal is won or lost on condition, the comps, and the renovation math.
Momentum Buy Score.
Our proprietary 0 to 10 read across the factors that decide how a home in Bridgewater buys, holds, and resells. Momentum Research; not an appraisal.
Momentum Intelligence Scores are our proprietary, qualitative assessment on a 0 to 10 scale, built from the record-level market data on this page. They are a framework for comparing communities, not a guarantee of future value and not advice on a specific home; unlike an automated value estimate they do not price your home, they grade the community on evidence you can inspect. Composite is the plain average of the 3 factors (7.2). Basis: Recent Direction +0.6% year-over-year; Liquidity & Demand 2.2 months of supply; Pricing Power 96.3% sale-to-list. Refreshed with each data update.
HOA, CDD & Fees
- No CDD
- HOA reported ~$65/month
- Any club/amenity membership is billed separately
Confirm the current HOA dues, exactly what they cover, and any CDD bond or special assessment for a specific address before you offer.
Page states no CDD.
Tools for a Bridgewater buy.
Free calculators to pressure-test the real cost before you tour.
Selling here is won on condition and pricing to real comps, not an automated estimate. The right number comes from closed Bridgewater sales matched to your home.
Price it to the comps and condition, not an automated estimate.
If you are thinking about selling in Bridgewater, the right list price comes from recent comparable sales matched to your home's condition and location, not an automated estimate.
What is your Bridgewater home worth?
Get a no-obligation home value based on real comparable sales in Bridgewater, not an automated guess. Tell us about your home and we will personally prepare your numbers and a pricing strategy. No obligation, no spam.
See all homes for sale in St. Augustine →
Or get your Bridgewater home value & selling guide →
Recently off market in Bridgewater
Homes in Bridgewater that recently left the market. Each address opens its public-record profile: county-recorded value, property taxes, the last recorded sale, community sales history, and what is for sale nearby now. 12 on record.
- 112 Pomona Way · off market
- 127 Pomona Way · off market
- 204 Pasadena Drive · off market
- 22 Blue Haven Road · off market
- 263 Talulla Trail · off market
- 28 Pasadena Drive · off market
- 32 Pasadena Drive · off market
- 34 Pasadena Drive · off market
Price History: What Homes Here Have Actually Sold For
Median sale prices in Bridgewater Homes for Sale in St year by year since 2012, from closed MLS sales. Long-run history beats any single estimate: it shows what this community has actually done through rate cycles, not what a model guesses.
Frequently Asked Questions
What is the median home price in Bridgewater?
How long do homes in Bridgewater take to sell?
Is Bridgewater a buyer's or seller's market right now?
What schools serve Bridgewater?
Who is the best real estate agent for Bridgewater?
How do I find a top St. Augustine real estate agent who knows Bridgewater?
Can Momentum Realty connect me with an agent for Bridgewater?
Data sources & freshness
| Live listings | realMLS, refreshed twice daily (last: June 13, 2026) |
| Community market stats | realMLS closed sales, 12-month windows ending August 10, 2026 |
| Under-contract shares | realMLS records, as of 2026-08-10 |
| Schools | 2025-26 district assignments + FLDOE school grades; verify with the district |
| Historical depth | Closed-sale records back to 2008 (638 transactions analyzed) |
Verify the primary sources yourself: Florida DOR · U.S. Census · FEMA flood maps · Citizens Property Insurance.
Momentum Research figures are our own analysis of realMLS records; MLS data is deemed reliable but not guaranteed. Methodology: how Momentum market scores are computed. Market metrics describe homes for sale and recent sales, not residents.
Own a home here?
You just read the data. Now see what your home is worth.
The numbers on this page move markets in the aggregate. The number that matters to you is what a buyer pays for your address. Momentum sells for 1.25% above the realMLS member average and 8 days faster, and we’ll price yours against live your area comps.
Looking to buy here? Search homes for sale →
What’s your home worth in your area?
A real valuation with real comps from a local listing agent, not an instant algorithm. Response within one business day.
See how Bridgewater fits the bigger picture — live prices, inventory, and Momentum Scores: