
Tidewater
Homes for Sale in Estero, FL
All 255 homes for sale in Estero, FL · median $326,000 · 387 homes for sale in 33928 · Lee County homes for sale
True comps, carrying-cost math, and listings before the portals.
Market Heat
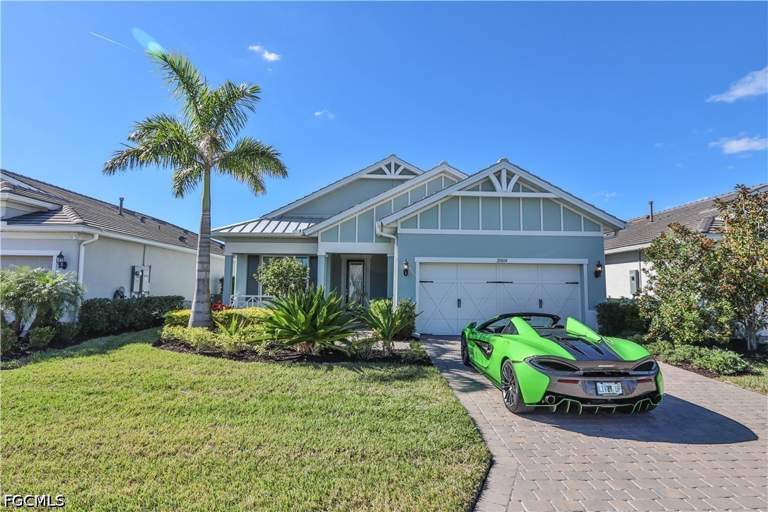
Photo via Florida Gulf Coast MLS
As of October 2026, Tidewater in Estero, FL has 7 homes for sale and 2 pending, asking from $419,000 to $675,000 (median $485,000). Over the 12 months ending 2026-09-20, 32 recorded sales closed at a median of $525,000, $300 per square foot, a median 62 days on market, sellers accepting 94% of original asking (-5% versus the prior year). Homes listed or recently sold were built 2016–2020; 8 of 9 report an HOA (median $489/mo); 1 of the 9 geocoded homes sit in a FEMA special flood hazard zone (median elevation 20 ft). At the median price and Lee County's FY2025-26 rate of 15.97 mills, annual property tax runs about $8,380 ($7,720 with the full homestead exemption).
Last 30 days in Tidewater: 3 new listings (median asking $648,000), 2 under contract right now. As of October 20, 2026, Listing information provided by the Florida Gulf Coast Multiple Listing Service, Inc. Information is deemed reliable but not guaranteed by the MLS to be accurate.
Homes For Sale Right Now in Tidewater
Live MLS inventory for Tidewater. Every active listing, what is under contract right now, and the last 12 months of closed sales, refreshed twice a day. Closed comps beat an algorithm's guess every time.
Active and pending Tidewater listings as of 2026-10-19, priced high to low. Listing information provided by the Florida Gulf Coast Multiple Listing Service, Inc. Information is deemed reliable but not guaranteed by the MLS to be accurate. Tap any home to ask about it.

Tidewater's pricing is driven by size and age, not amenities. With a median living area of 3,034 square feet and a build window concentrated between 2015 and 2021, this is a community of larger, newer-construction homes, and the median price of $520,000 reflects that footprint more than any clubhouse or gate. Price per square foot sits at $299.84, which is the number to watch when comparing individual listings, since square footage varies more here than lot or location.
The current posture favors buyers willing to negotiate. A market heat score of 28 and median days on market just over 62 point to a slower-moving inventory, and the year-over-year price change of -9.8% confirms sellers are adjusting expectations rather than testing the top of the market. For sellers, that means pricing at or near recent comparables rather than last year's numbers; for buyers, it means there's room to negotiate on condition and terms rather than racing a bidding war.
Figures in this note are as of July 29, 2026. The live market numbers elsewhere on this page update nightly and are newer.
Tidewater right now
🟡 Off the recent peak. The trailing-12-month median ($525K) is down 5.0% from the prior 12 months ($552K). With about 22 sales a year, a single closing can swing this number, so read the level and the decade, not one year's move.Momentum Research, record-level Florida Gulf Coast MLS closed sales, 12-month windows ending September 20. Confidence: High (32 and 24 sales in the two windows).
Jump to: Price history & scorecard · Homes for sale · Schools · FAQ
· Updated October 20, 2026 · Live data: Florida Gulf Coast MLS, refreshed twice daily · MLS facts carry their source; interpretation lines are Momentum Research · Data sources & freshness
The 60-Second Overview
Tidewater market snapshot (as of September 20, 2026): the median sale price is about $525K ($300 per sq ft over the trailing 12 months of closed sales), and a median 63 days on market for closed sales. The trailing-12-month median is down 5% from the prior 12 months, computed from record-level Florida Gulf Coast MLS closed sales (32 closings in the current window).
In ZIP 33928 (Estero), 1,490 homes closed in the last 12 months at a median of $504K ($256/sq ft), down 2.6% year over year, with a median 66 days on market. Right now 412 active and 130 pending listings — a buyer's market. See the live ZIP 33928 housing market and the Lee County market.
County records show 11 qualified sales in Tidewater across 2024–2025 (5 in 2024, 6 in 2025), median $500,000 — the last recorded sale per parcel on the Florida DOR 2025 assessment roll, independent of the MLS.
Tidewater is a community of 118 homes in Estero, Lee County, built between 2016 and 2019 (median 2017), with a median living area of about 2,689 square feet. 80% of parcels are homesteaded, the owner-occupancy proxy in the Florida DOR assessment roll (2025 roll, public records).
Tidewater is a newer-build community in Estero, with homes constructed almost entirely between 2015 and 2021 and a median size over 3,000 square feet. A homestead share of 80.3% indicates most owners have filed for the property as their primary residence, rather than holding it as a rental or seasonal property.
The setting & the homes.
Aerial and on-site photos of Tidewater. Swipe to explore the community.
Swipe or use the arrows → tap any photo to enlarge
 Tidewater
 Tidewater
 Tidewater
 Tidewater
 Tidewater
 Tidewater
 Tidewater
 Tidewater
Photos from Florida Gulf Coast MLS listings in Tidewater; content deemed reliable but not guaranteed.
Who Tidewater is best for.
Best for
- Buyers prioritizing larger square footage in a newer-construction home over community amenities.
- Buyers comfortable negotiating on price given the current days-on-market and year-over-year trend.
- Buyers planning to homestead the property as a primary residence, consistent with the community's ownership pattern.
Probably not for
- Buyers who want on-site amenities as part of the purchase, since none are currently identified in MLS listings.
- Sellers expecting a fast turnaround, given the median days-on-market well past two months.
- Buyers pricing off last year's comparables without accounting for the recent year-over-year pullback.
Price History: What Homes Here Have Actually Sold For
Median sale price over the trailing 12 months ending September 20 of each year, from record-level Florida Gulf Coast MLS closed sales. Same methodology as every appreciation figure on this page: the 2026 point ($525K) IS the median in the snapshot above, and the move from 2025 ($552K) IS the -5.0% one-year change.
Windows contain 8 to 43 sales each (32 in the current window); every figure carries its sample size. Listing information provided by the Florida Gulf Coast Multiple Listing Service, Inc. Information is deemed reliable but not guaranteed by the MLS to be accurate. Deemed reliable but not guaranteed.
19% of homes for sale in ZIP 33928 are already under contract (under contract ÷ under contract + active listings) — a read on how much of the available inventory buyers have already claimed. Source: MLS data (2026-10-20).
Tidewater Market Scorecard
Tidewater is currently a balanced market., a median asking price of $459,000, and homes go under contract in about 39 days.
Go deeper: ZIP market scorecard · county scorecard · true cost calculator · affordability calculator.
Live data: Florida Gulf Coast MLS, refreshed twice daily. Market metrics only; these describe homes for sale and recent sales, not residents.
Tidewater on the map.
Every active, pending, and recently sold home, plotted. Toggle the layers and tap a home for the details.
Listing locations from Florida Gulf Coast MLS. Map data © OpenStreetMap contributors.
The Tidewater buying strategy.
If we were buying in Tidewater today, this is the order of operations we would run for our clients.
Underwrite the condition first. Price the roof, HVAC, and systems honestly before judging any list price; condition swings value here more than square footage alone.
Match the home to real comps. Recent sales of similar condition and lot, not the asking price, tell you what a home is worth.
Move deliberately, not desperately. Neither side has a decisive edge, so a well-prepared, fairly-priced offer wins without overpaying.
Line up financing and inspection early. A pre-approval and an inspection plan let you act fast and negotiate from evidence.
Keep an agent in your corner. The listing agent works for the seller; we represent you and prepare a hand-built valuation before any offer in Tidewater.
Newer Construction, Slower Market
The story in Tidewater right now is less about scarcity and more about time. Median days on market at 62.5 is a meaningful stretch for a community of only 386 homes, and paired with a market heat score of 28, it signals listings are sitting long enough for buyers to be selective on condition, layout, and price per square foot rather than moving on the first showing.
The -9.8% year-over-year change is worth sitting with rather than reacting to. It doesn't mean every home is down that much; it reflects the mix of what's closed in the trailing window against what closed a year prior. With homes built across a fairly tight six-year span (2015-2021) and a median build year of 2018, condition and updates since construction will do more to explain a given sale price than the calendar year on the build permit.
The location and the amenities are priced into every listing in Tidewater. The deal is won or lost on condition, the comps, and the renovation math.
Momentum Buy Score.
Our proprietary 0 to 10 read across the factors that decide how a home in Tidewater buys, holds, and resells. Momentum Research; not an appraisal.
Momentum Intelligence Scores are our proprietary, qualitative assessment on a 0 to 10 scale, built from the record-level market data on this page. They are a framework for comparing communities, not a guarantee of future value and not advice on a specific home; unlike an automated value estimate they do not price your home, they grade the community on evidence you can inspect. Composite is the plain average of the 3 factors (6.1). Basis: Recent Direction -5.0% year-over-year; Owner Commitment 80% owner-occupied; Pricing Power 93.6% sale-to-list. Refreshed with each data update.
Why work with Momentum here
In a community with only 386 homes and a slower sales pace, pricing strategy and negotiation matter more than in a hot market where any number works. Momentum tracks Tidewater's price-per-square-foot and days-on-market trends closely enough to tell a seller where to actually price against recent closings, and to help a buyer know when a longer market sit means there's real room to negotiate.
Tidewater in 15 seconds.
What it really costs to own in Tidewater
The parts of the monthly number a mortgage calculator leaves out, from the tax roll, the MLS, Citizens and FEMA. Property facts only.
| Property tax | Current owners' bills run a median of $4,930/yr across 18 listings here (MLS tax records, 2026-10-20). |
|---|---|
| HOA dues | Median $489/month across 8 MLS listings (most billed quarterly; 2026-10-20). Dues cover what the documents say they cover; ask for the budget and reserve study. |
| Home and flood insurance | The average Citizens Property Insurance premium in Lee County is $2,197/yr (6,508 policies, Citizens detail by county, April 2026); private-market quotes depend on roof age, wind mitigation and construction. |
| Roof and age | Median build year 2017 across 18 listings. An original roof here is about 9 years old: still inside the 15-year window Florida carriers use, but ask for the roof's permit date before you bind coverage. |
Estimated carrying cost at the median asking price, before the mortgage: about $1,083/month (tax $411, HOA $489, insurance $183). An estimate from the sources above, not a quote.
Email me new listings in Tidewater
One e-mail a day, only when a home lists here, with price, beds, baths and a link to every listing. Straight from the MLS feed; no account needed.
Ask an agent about Tidewater
Have a question about the homes, fees, rules or commute here? A Momentum agent who works Tidewater will answer, and the answer is published on this page for the next buyer.
HOA, CDD & Fees
- HOA dues reported around $489/month (about $5,868/yr) · median of 8 MLS listings, most billed quarterly
- Any club/amenity membership is billed separately
Listings in this community report association dues of about $489 per month ($5,868 a year) — the median AssociationFee across 8 MLS records, normalised to a monthly figure; most are billed quarterly. Dues change with budgets and can differ by section or product type; confirm the current figure with the association before you offer. Source: MLS listing records, 2026-10.
Confirm the current HOA dues, exactly what they cover, and any CDD bond or special assessment for a specific address before you offer.
Tools for a Tidewater buy.
Free calculators to pressure-test the real cost before you tour.
Selling here is won on condition and pricing to real comps, not an automated estimate. The right number comes from closed Tidewater sales matched to your home.
Price it to the comps and condition, not an automated estimate.
If you are thinking about selling in Tidewater, the right list price comes from recent comparable sales matched to your home's condition and location, not an automated estimate.
What is your Tidewater home worth?
Get a no-obligation home value based on real comparable sales in Tidewater, not an automated guess. Tell us about your home and we will personally prepare your numbers and a pricing strategy. No obligation, no spam.
See all homes for sale in Estero →
Recently off market in Tidewater
Homes in Tidewater that recently left the market. Each address opens its public-record profile: county-recorded value, property taxes, the last recorded sale, community sales history, and what is for sale nearby now. 4 on record.
- 10574 Tidewater Key Blvd · off market
- 10582 Jackson Square Dr · off market
- 10586 Tidewater Key Blvd · off market
- 20128 Torch Key Way · off market
| Location | Estero, Lee County, FL · ZIP 33928 |
|---|---|
| Homes in the community | 118 (FL DOR 2025 assessment roll) |
| Years built | 2016–2019 (median 2017) |
| Typical living area | 2,689 sq ft (median) |
| Home types (current listings and sales) | attached 78%, singlefamilyresidence 22% |
| Sale prices, last 12 months | $525,000 median across 32 closed sales · $300 per sq ft · -5.0% vs the prior 12 months |
| Days on market (closed sales) | 62 median |
| For sale right now | 7 active, 1 pending · median asking $459,000 |
| Owner-occupied (homestead) share | 80% |
Data as of September 20, 2026. Listing information provided by the Florida Gulf Coast Multiple Listing Service, Inc. Information is deemed reliable but not guaranteed by the MLS to be accurate; housing-stock figures from Florida Department of Revenue public records. Market figures describe homes, not residents. Cite as: Momentum Realty, “Tidewater key facts,” movewithmomentum.com/neighborhoods/tidewater, data as of September 20, 2026.
Housing distress & ownership in Tidewater, Estero
Who owns here, how much is not owner-occupied, and how much for-sale inventory is under distress.
Source: Momentum Realty Research. Ownership & parcels from the FL DOR 2025 tax roll; distress from MLS active-listing status/remarks; price from MLS closed sales. Listing information provided by the Florida Gulf Coast Multiple Listing Service, Inc. Information is deemed reliable but not guaranteed by the MLS to be accurate. Deemed reliable but not guaranteed.
Just listed in Tidewater
The newest homes for sale in Tidewater right now, newest first. Each link opens the full listing with every photo, the price history and a tour request.
- 20014 Wymberly Way $675,000 · 3 bd · 2 ba · 2,107 sq ft · new today Courtesy of Realty One Group MVP
- 10517 Tidewater Key Blvd $648,000 · 3 bd · 2 ba · 2,107 sq ft · new today Courtesy of John R Wood Properties
- 10657 Jackson Square Dr $449,000 · 2 bd · 2 ba · 1,544 sq ft · 29 days on market Courtesy of Compass Florida, LLC
- 10647 Tiki Ct $625,000 · 3 bd · 3 ba · 2,455 sq ft · 39 days on market Courtesy of Compass Florida, LLC
- 10661 Jackson Square Dr $449,000 · 2 bd · 2 ba · 1,544 sq ft · 49 days on market Courtesy of John R Wood Properties
- 20005 Parrot Key Ct $419,000 · 3 bd · 2 ba · 1,544 sq ft · 84 days on market Courtesy of John R Wood Properties
Checked against the MLS Oct 20, 2026. All new listings in this market.
Every Home for Sale in Tidewater Right Now (9)
All 9 active and pending Tidewater listings with a detail page, newest first, refreshed twice a day from the MLS.
- 10517 Tidewater Key Blvd · $648,000 · 3 bd / 2 ba · listed Sep 25, 2026 · listed by John R Wood Properties
- 10641 Jackson Square Dr · $445,000 · 2 bd / 2 ba · pending · listed Sep 25, 2026 · listed by Local Real Estate LLC
- 20014 Wymberly Way · $675,000 · 3 bd / 2 ba · listed Sep 11, 2026 · listed by Realty One Group MVP
- 10657 Jackson Square Dr · $449,000 · 2 bd / 2 ba · listed Sep 6, 2026 · listed by Compass Florida, LLC
- 20179 Torch Key Way · $429,000 · 2 bd / 2 ba · pending · listed Sep 4, 2026 · listed by John R Wood Properties
- 10647 Tiki Ct · $625,000 · 3 bd / 3 ba · listed Sep 2, 2026 · listed by Compass Florida, LLC
- 10661 Jackson Square Dr · $449,000 · 2 bd / 2 ba · listed Aug 21, 2026 · listed by John R Wood Properties
- 10779 Manatee Key Ln · $485,000 · 2 bd / 2 ba · listed Jul 23, 2026 · listed by Berkshire Hathaway Florida
- 20005 Parrot Key Ct · $419,000 · 3 bd / 2 ba · listed Jul 22, 2026 · listed by John R Wood Properties
More Estero home searches
- All homes for sale in Estero, FL
- Homes for sale in Lee County, FL
- Homes under $300K in Estero
- Homes from $300K to $500K in Estero
- 4-bedroom homes for sale in Estero
- Estero home values: what is my house worth?
- ZIP 33928 housing scorecard
- 6 coming-soon communities in Lee County
Estero guides & data
- Market data
- Best neighborhoods (ranked by data)
- Flood zones
- Home insurance cost
- New construction
- ZIP codes
Florida buyer guides
- Florida home insurance rates by county
- Florida property tax by county
- Florida property tax calculator
- What flood zone X means
- The 4-point inspection, explained
- Florida flood insurance calculator
Real estate agent in Estero? Join Momentum in Estero: 100% commission, one $12K cap.
Streets in this community
Street-level pages: every home on record, what sold and what is for sale on each street.
- Jackson Square Drive (4 homes on record)
- Jackson Square Drive (1 homes on record)
Recent Developments in Tidewater
Development, infrastructure, retail, and school activity affecting Tidewater, tracked by our team and summarized from public reporting and official sources, with links to the original coverage. Last updated October 2026.
- September 2026Development
Ritz-Carlton Residences, Estero Bay tops off second tower
The second of two 22-story towers at 5000 Coconut Road reached full height on Sept. 18, 2026, completing the 224-residence project by London Bay and Coastal Construction. Tower One is more than 90% purchased and Tower Two about 45%. Move-ins and completion are scheduled for August 2027.
What it may mean for the marketAdds high-end waterfront condominium inventory in the Estero and Bonita Springs area, with completion expected in August 2027. The site is about 2 miles southeast of Tidewater.
Source: Gulfshore Business - August 2026Development
Audubon and Cameratta settle lawsuit over 10,000-home Kingston community
Audubon and Cameratta Companies settled a federal suit over the Kingston permit; Cameratta will buy about 98 acres off Carter Road and give up a 100-foot easement for a road through Corkscrew Swamp Sanctuary. Kingston covers about 6,700 acres in eastern Lee County, with first model homes expected within about two months.
What it may mean for the marketRemoves a legal obstacle to a master-planned community of about 10,000 homes east of Estero, and rules out a road link into Collier County through the sanctuary. The site is about 11 miles east of Tidewater.
Source: Gulfshore Business - July 2026Infrastructure
New Big Carlos Pass Bridge opens in Lee County
The new fixed-span Big Carlos Pass Bridge connecting the south end of Estero Island with Lovers Key officially opened and was dedicated June 30, 2026. The $90.8 million project replaces an older drawbridge and provides 60 feet of boat clearance along with bicycle lanes and sidewalks. Concrete from the demolished drawbridge was repurposed into an artificial reef offshore.
What it may mean for the marketA new high-span bridge upgrades the coastal road connection and removes the delays associated with the former drawbridge. The project is about 4 miles west of Tidewater, elsewhere in Lee County.
Source: Gulfshore Business - June 2026Retail & Dining
High 5 Entertainment underway at Village Hub SportsPark in Estero
Vertical construction is underway on a High 5 Entertainment venue at the Village Hub SportsPark on the north side of Williams Road in Estero. The facility will include the 21-court Estero Pickleball Club, a 16-lane bowling alley, two miniature golf courses, an arcade, a full-service kitchen and bar, and retail space. The CEO said construction should finish within six to eight months, targeting soft openings in February 2027.
What it may mean for the marketA new entertainment and dining venue adds recreational and commercial space to the Estero activity hub. The project is about 3 miles north of Tidewater, elsewhere in Lee County.
Source: Gulfshore Business - June 2026Retail & Dining
Fort Myers Beach approves Development Order for Times Square entertainment center with hotel and restaurant
Fort Myers Beach town staff issued a Development Order for a three-story mixed-use entertainment center at 1028 and 1046 Estero Boulevard at Times Square, on the former sites of Sunset Beach Tropical Grill and The Playmore Tiki Bar. The 41,285-square-foot project by Persaud Properties would include six hotel units, a restaurant, shopping, a bar, an entertainment venue with a stage and a public pool. No construction permits had been issued as of the approval, with additional environmental and stormwater approvals still required.
What it may mean for the marketA new mixed-use entertainment building would add hotel, dining and retail space to the Times Square commercial district and support its post-storm rebuild. The project is about 10 miles west of Tidewater, elsewhere in Lee County.
Source: Fort Myers Beach Observer - May 2026Development
Estero board reviews 370-unit mixed-use complex at Estero Parkway and Three Oaks Parkway
The Estero Planning, Zoning and Design Board on May 19, 2026 reviewed The Residential Group's proposal for a mixed-use development on 5.275 acres at the southwest corner of Estero Parkway and Three Oaks Parkway. The plan calls for 370 apartments and 33,000 square feet of commercial space and requests a zoning change from a 1994 commercial planned development to a mixed use planned development. The proposal projects fewer daily trips and lower density than the previously approved shopping center.
What it may mean for the marketThe plan would convert an aging commercial site into new housing and ground-floor retail at a major intersection. The project is about 3 miles northeast of Tidewater, elsewhere in Lee County.
Source: Gulfshore Business
Summaries reflect public reporting and official sources linked above as of the dates shown. Project details, timelines, and approvals can change. Commentary on potential market effects is general observation, not investment advice or a prediction for any specific property. For the freshest items across the whole region, see This Week in Northeast Florida.
Frequently Asked Questions
What is the median home price in Tidewater?
How long do homes in Tidewater take to sell?
How many homes are in Tidewater?
What share of Tidewater is owner-occupied?
When were the homes in Tidewater built?
Who is the best real estate agent for Tidewater?
How do I find a top Estero real estate agent who knows Tidewater?
Can Momentum Realty connect me with an agent for Tidewater?
Where is Tidewater, and what county is it in?
Is Tidewater a good place to live?
Should you buy in Tidewater?
An honest fit check. We will tell you when it is not your community.
Data sources & freshness
| Live listings | Florida Gulf Coast MLS, refreshed twice daily (last: October 19, 2026) |
| Community market stats | Florida Gulf Coast MLS closed sales, 12-month windows ending September 20, 2026 |
| Housing stock & ownership | Florida DOR assessment roll (street-list match (2 streets, ZIP 33928)) |
| Under-contract shares | Florida Gulf Coast MLS records, as of 2026-09-20 |
| Historical depth | Closed-sale records back to 2016 (233 transactions analyzed) |
Verify the primary sources yourself: Florida DOR · U.S. Census · FEMA flood maps · Citizens Property Insurance.
Momentum Research figures are our own analysis of Florida Gulf Coast MLS records; MLS data is deemed reliable but not guaranteed. Methodology: how Momentum market scores are computed. Market metrics describe homes for sale and recent sales, not residents.
Own a home here?
You just read the data. Now see what your home is worth.
The numbers on this page move markets in the aggregate. The number that matters to you is what a buyer pays for your address. Momentum sells for 1.25% above the Florida Gulf Coast MLS member average and 8 days faster, and we’ll price yours against live local comps.
Looking to buy here? Search homes for sale →
What’s your home worth in your area?
A real valuation with real comps from a local listing agent, not an instant algorithm. Response within one business day.
See how Tidewater fits the bigger picture — live prices, inventory, and Momentum Scores:
More on Tidewater
- Home values · What homes in Tidewater actually sell for
Nearby Communities
Explore more neighborhoods near Tidewater with Momentum Realty’s local guides.