

Palencia
Homes for Sale in St. Augustine, FL
All 1,292 homes for sale in St. Augustine, FL · median $489,994 · 207 homes for sale in 32095 · St. Johns County homes for sale
True comps, carrying-cost math, and listings before the portals.
Market Heat
Meet your Palencia neighborhood experts
Get firsthand insight from local Momentum Realty agents who know Palencia, its homes and its housing market. Questions about sections, builders, HOA and CDD fees, or current prices? Ask below.

Jason
Local neighborhood expert

Heather
Local neighborhood expert

Palencia sits in the upper end of the St. Johns County market, with a median around $710,000 and roughly $253 per square foot. That pricing reflects an amenity-driven, gated community more than a raw dirt-and-square-footage calculation — you are paying for the built environment and the location off US-1, not just the house.
The current posture is balanced, leaning cool. A median of about 54 days on market and a heat score of 44 tell you sellers are not naming their price the way they could a few years ago. Year-over-year values are up only 1.6%, so appreciation has flattened after a long run. Buyers have room to negotiate and time to inspect; sellers should price to the comps, not to memory.
Figures in this note are as of July 12, 2026. The live market numbers elsewhere on this page update nightly and are newer.
Palencia right now
🟡 Off the recent peak. The trailing-12-month median ($688K) is down 7.1% from the prior 12 months ($740K) and up 111% since 2012.Momentum Research, record-level realMLS closed sales, 12-month windows ending October 23. Confidence: Very High (116 and 83 sales in the two windows).
Jump to: Price history & scorecard · Homes for sale · Schools · FAQ
· Updated October 24, 2026 · Live data: realMLS, refreshed twice daily · MLS facts carry their source; interpretation lines are Momentum Research · Data sources & freshness
Nearby homes for sale
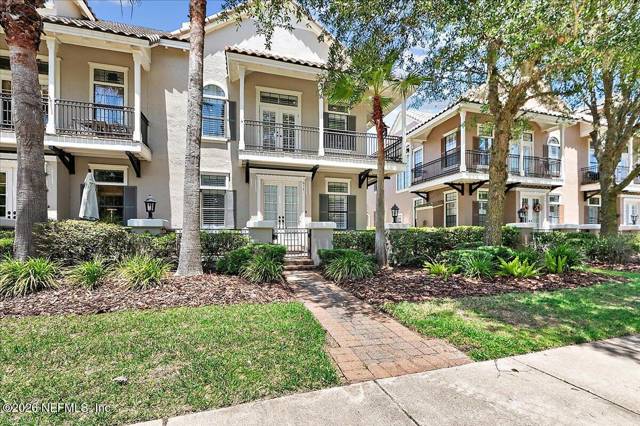
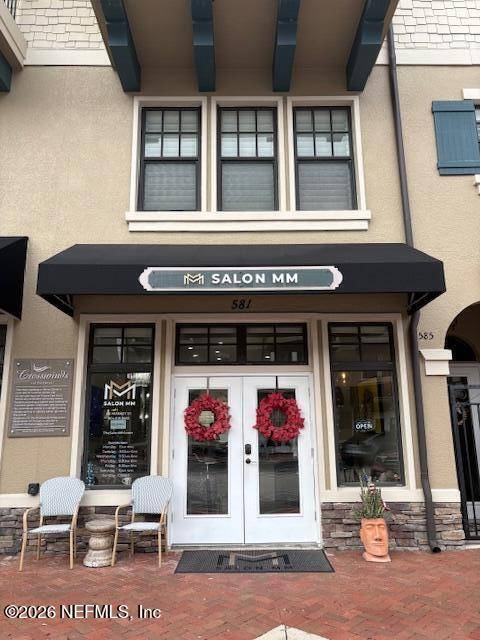
No active listings inside Palencia right now. These are the 6 closest homes on the market, by straight-line distance from the community's center; some may sit just outside its boundary.
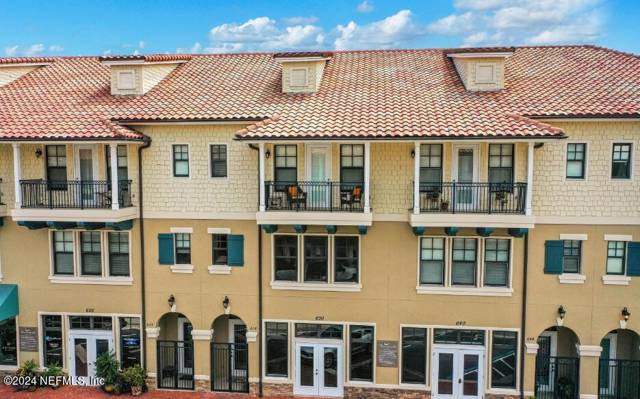
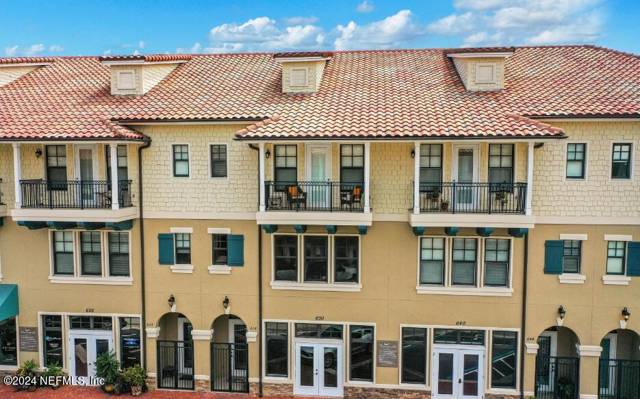
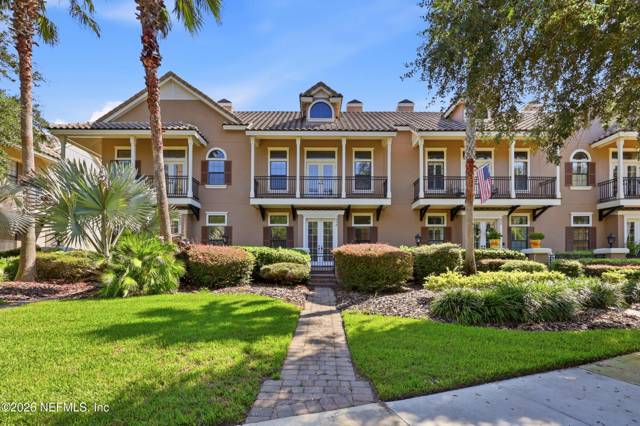
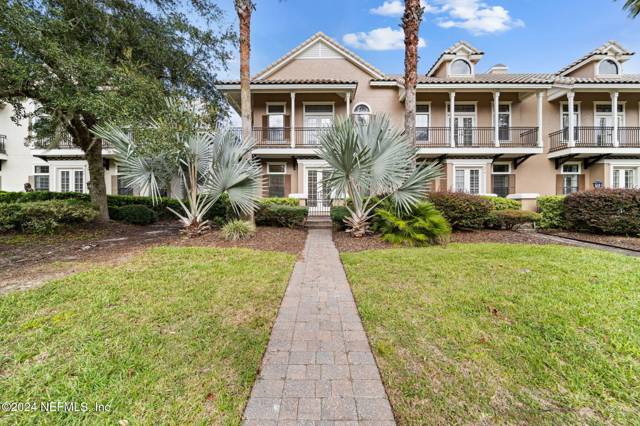
Listing data from the MLS feeds named on each listing page; deemed reliable but not guaranteed. Refreshed nightly.
Palencia (St. Augustine, FL): Homes, Prices & What to Know (Q4 2026 update)
Palencia is a St. Augustine golf community with a $675,000 median sold price, down 9.9%, and 46 median days to sell. Numbers from realMLS, county property appraisers and public records, refreshed nightly on this page.
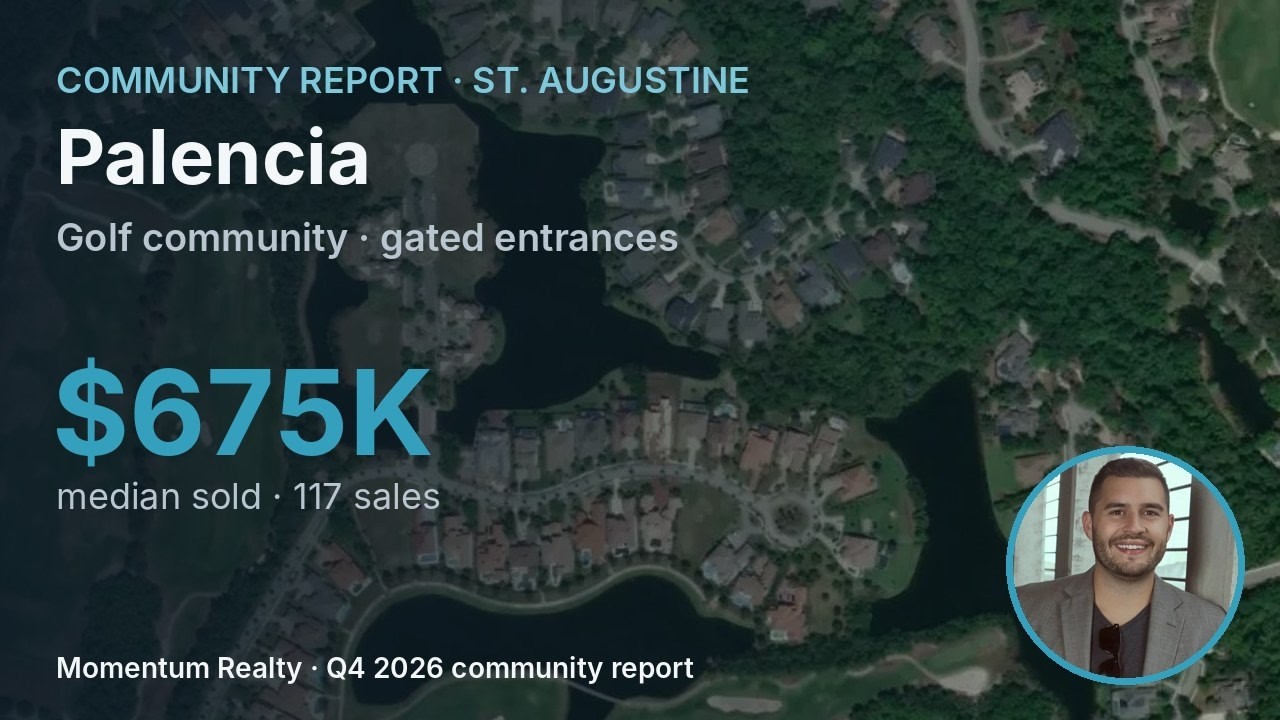
1 min 56 s · Momentum Realty on YouTube · data from realMLS, St. Johns County Property Appraiser, Citizens, FEMA · Equal Housing Opportunity
Key moments
- 0:00 Palencia in one number
- 0:16 How the community is laid out
- 0:38 The Palencia market right now
- 1:05 How to read this community
- 1:27 What it costs to own
- 1:45 Get alerts when homes list
Transcript
Palencia, in St. Augustine, is a St. Johns County golf community where the median sold price is 675,000 dollars, down 9 point 9 percent, and homes take a median of 46 days to sell. Here's what that means if you're watching this one.
Palencia is a golf community with gated entrances in St. Augustine, in St. Johns County. The page lists an 18-hole Arthur Hills golf course, three community pools, ten clay tennis courts, a fitness center, a 30-acre park system, and a boardwalk to a fishing pier. Club memberships are billed separately, so verify access and terms.
In the last 12 months, 117 homes sold at a median of 675,000 dollars, down 9 point 9 percent on 117 sales against 83. That's 254 dollars a square foot, below a 2025 peak of 264, at 95 point 2 percent of asking. In ZIP 32095, 30 percent of homes for sale are already under contract.
With homes taking a median of 46 days and selling at 95 point 2 percent of asking, buyers here typically have some room to negotiate. That's typical, not a promise. The prior 12 months had a median of 749,000 dollars, so compare any list price to recent closings. Verify the HOA, any CDD, and club fees.
The page doesn't publish a property tax figure or millage for Palencia, so ask for the current bill. HOA dues aren't reported consistently in the listing data here, so ask for the current dues and what they cover. The page doesn't say whether a CDD applies. Get insurance quoted by address.
Get an email the moment new homes list: the alerts box is on the Palencia page at move with momentum dot com, updated every night. I'm Jon Brooks with Momentum Realty.
The 60-Second Overview
Palencia market snapshot (as of October 23, 2026): the median sale price is about $688K ($255 per sq ft over the trailing 12 months of closed sales), and a median 46 days on market for closed sales. The trailing-12-month median is down 7% from the prior 12 months and up 111% since 2012, computed from record-level realMLS closed sales (116 closings in the current window).
In ZIP 32095 (St. Augustine), 951 homes closed in the last 12 months at a median of $498K ($221/sq ft), down 1.5% year over year, with a median 50 days on market. Right now 148 active and 76 pending listings put supply at about 4.7 months — a balanced market. See the live ZIP 32095 housing market and the St. Johns County market.
County records show 161 qualified sales in Palencia across 2024–2025 (108 in 2024, 53 in 2025), median $745,000 — the last recorded sale per parcel on the Florida DOR 2025 assessment roll, independent of the MLS.
Palencia is a community of 2,022 homes in St. Augustine, St. Johns County, built between 1900 and 2024 (median 2014), with a median living area of about 3,390 square feet. 77% of parcels are homesteaded, the owner-occupancy proxy in the Florida DOR assessment roll (2025 roll, public records).
Palencia is an amenity-heavy, gated community in northern St. Johns County, positioned along the US-1 corridor between St. Augustine and the Jacksonville line. The pricing reflects that packaged lifestyle rather than the surrounding market's baseline.
Who Palencia is best for.
Best for
- Buyers with a budget around $700,000 who want a gated community with built-in amenities and are planning a longer hold.
- Move-up buyers prioritizing location on the northern St. Johns corridor and willing to pay for the package.
- Patient buyers ready to use the current 54-day market to negotiate on overpriced or aging listings.
Probably not for
- Buyers seeking an entry price well below the low-$700s median.
- Anyone counting on rapid, short-term appreciation given the flat 1.6% year-over-year move.
- Buyers who want no HOA structure or community amenity costs baked into the price.
Price History: What Homes Here Have Actually Sold For
Median sale price over the trailing 12 months ending October 23 of each year, from record-level realMLS closed sales. Same methodology as every appreciation figure on this page: the 2026 point ($688K) IS the median in the snapshot above, and the move from 2025 ($740K) IS the -7.1% one-year change.
Windows contain 74 to 225 sales each (116 in the current window); every figure carries its sample size. Source: Data provided by realMLS. Deemed reliable but not guaranteed.
32% of homes for sale in ZIP 32095 are already under contract (under contract ÷ under contract + active listings) — a read on how much of the available inventory buyers have already claimed. Source: MLS data (2026-10-20).
Life at Palencia
- Palencia Club golf course · 18-hole, 7,071-yard championship course designed by Arthur Hills, routed through maritime oak trees along the Intracoastal Waterway and Tolomato River; holds Audubon Sanctuary status since 2002.
- Golf practice facilities · 400-yard double-sided driving range plus roughly 10,000 square feet of putting and chipping practice area.
- Swimming pools · Three community swimming pools.
- Tennis and pickleball complex · Ten hydro-grid clay tennis courts, two junior courts, and two pickleball courts.
- Fitness center · On-site fitness center with gym and aerobics room.
- Athletic fields · Community athletic fields for field sports.
- Park and trail system · 30-acre park system with interconnected boardwalks and fitness trails, plus pocket parks and picnic pavilions.
- Tolomato River boardwalk and fishing pier · Boardwalk of roughly one mile leading to a fishing pier along the Intracoastal Waterway/Tolomato River, part of a broader two-mile boardwalk system.
- Community and amenity center · Community center with banquet hall and separate amenity center.
Sources: The Palencia Club - Golf; Palencia Online - community site; Visit St. Augustine - Palencia community page; Julie Little - Palencia Living blog. Amenity access and membership terms vary and can change; verify current details with the community.
The Palencia buying strategy.
If we were buying in Palencia today, this is the order of operations we would run for our clients.
Underwrite the condition first. Price the roof, HVAC, and systems honestly before judging any list price; condition swings value here more than square footage alone.
Match the home to real comps. Recent sales of similar condition and lot, not the asking price, tell you what a home is worth.
Move deliberately, not desperately. Neither side has a decisive edge, so a well-prepared, fairly-priced offer wins without overpaying.
Line up financing and inspection early. A pre-approval and an inspection plan let you act fast and negotiate from evidence.
Keep an agent in your corner. The listing agent works for the seller; we represent you and prepare a hand-built valuation before any offer in Palencia.
A flat year after a long climb
The long-term story here is real: values are up roughly 153% since 2012. That is the context every seller carries into a listing conversation. But the last twelve months tell a different chapter — up just 1.6%, which is essentially flat once you account for normal noise. The community has moved from rapid appreciation into a holding pattern.
With about 106 closings in the window and a median near 54 days on market, this is a functioning but unhurried market. There is enough transaction volume to establish honest comps, and enough time on market that overpriced listings sit. For a buyer, that means leverage on the right property. For a seller, it means the first two weeks of pricing matter more than the story of what the home was worth in the past cycle.
The location and the amenities are priced into every listing in Palencia. The deal is won or lost on condition, the comps, and the renovation math.
Momentum Buy Score.
Our proprietary 0 to 10 read across the factors that decide how a home in Palencia buys, holds, and resells. Momentum Research; not an appraisal.
Momentum Intelligence Scores are our proprietary, qualitative assessment on a 0 to 10 scale, built from the record-level market data on this page. They are a framework for comparing communities, not a guarantee of future value and not advice on a specific home; unlike an automated value estimate they do not price your home, they grade the community on evidence you can inspect. Composite is the plain average of the 4 factors (6.6). Basis: Long-Term Appreciation +111% since 2012; Recent Direction -7.1% year-over-year; Owner Commitment 77% owner-occupied; Pricing Power 95.3% sale-to-list. Refreshed with each data update.
Why work with Momentum here
A community priced this far above the county baseline rewards precise comp work. We read the individual closings behind that $710,000 median rather than the headline, so buyers know when a list price is defensible and sellers know when they are leaving days on the table. In a market averaging around 54 days out, pricing and positioning at launch is the whole game — and that is where we spend our attention.
Palencia in 15 seconds.
Tools for a Palencia buy.
Free calculators to pressure-test the real cost before you tour.
Selling here is won on condition and pricing to real comps, not an automated estimate. The right number comes from closed Palencia sales matched to your home.
Price it to the comps and condition, not an automated estimate.
If you are thinking about selling in Palencia, the right list price comes from recent comparable sales matched to your home's condition and location, not an automated estimate.
What is your Palencia home worth?
Get a no-obligation home value based on real comparable sales in Palencia, not an automated guess. Tell us about your home and we will personally prepare your numbers and a pricing strategy. No obligation, no spam.
See homes for sale in Palencia on the map →
Housing distress & ownership in Palencia, St. Augustine
Who owns here, how much is not owner-occupied, and how much for-sale inventory is under distress.
Source: Momentum Realty Research. Ownership & parcels from the FL DOR 2025 tax roll; distress from MLS active-listing status/remarks; price from MLS closed sales. Source: Data provided by realMLS. Deemed reliable but not guaranteed.
More St. Augustine home searches
- All homes for sale in St. Augustine, FL
- Homes for sale in St. Johns County, FL
- St. Augustine pool homes for sale
- St. Augustine waterfront homes for sale
- Gated communities in St. Augustine
- St. Augustine golf course homes
- Homes under $300K in St. Augustine
- Homes from $300K to $500K in St. Augustine
- 4-bedroom homes for sale in St. Augustine
- St. Augustine home values: what is my house worth?
St. Augustine guides & data
- Market data
- Cost of living
- Best neighborhoods (ranked by data)
- Best neighborhoods
- Flood zones
- Property taxes (St. Johns County)
- Homestead exemption (St. Johns County)
- New construction
Florida buyer guides
- Florida home insurance rates by county
- Florida property tax by county
- Florida property tax calculator
- What flood zone X means
- The 4-point inspection, explained
- Florida flood insurance calculator
Real estate agent in St. Augustine? Join Momentum in St. Augustine: 100% commission, one $12K cap.
Email me new listings in Palencia
One e-mail a day, only when a home lists here, with price, beds, baths and a link to every listing. Straight from the MLS feed; no account needed.
Ask an agent about Palencia
Have a question about the homes, fees, rules or commute here? A Momentum agent who works Palencia will answer, and the answer is published on this page for the next buyer.
Frequently Asked Questions
What is the median home price in Palencia?
How long do homes in Palencia take to sell?
How many homes are in Palencia?
What share of Palencia is owner-occupied?
When were the homes in Palencia built?
Have Palencia home prices gone up?
Who is the best real estate agent for Palencia?
How do I find a top St. Augustine real estate agent who knows Palencia?
Can Momentum Realty connect me with an agent for Palencia?
Where is Palencia, and what county is it in?
How far is Palencia from downtown Jacksonville and the beach?
Is Palencia a good place to live?
Should you buy in Palencia?
An honest fit check. We will tell you when it is not your community.
Nearby Communities
Explore more neighborhoods near Palencia with Momentum Realty’s local guides.
Data sources & freshness
| Community market stats | realMLS closed sales, 12-month windows ending October 23, 2026 |
| Housing stock & ownership | Florida DOR assessment roll (street-list match (73 streets, ZIP 00000/32059/32084/32086/32092/32095/32257/32507/32567)) |
| Under-contract shares | realMLS records, as of 2026-10-20 |
| Historical depth | Closed-sale records back to 2002 (2,727 transactions analyzed) |
Verify the primary sources yourself: Florida DOR · U.S. Census · FEMA flood maps · Citizens Property Insurance.
Momentum Research figures are our own analysis of realMLS records; MLS data is deemed reliable but not guaranteed. Methodology: how Momentum market scores are computed. Market metrics describe homes for sale and recent sales, not residents.
Own a home here?
You just read the data. Now see what your home is worth.
The numbers on this page move markets in the aggregate. The number that matters to you is what a buyer pays for your address. Momentum sells for 1.25% above the realMLS member average and 8 days faster, and we’ll price yours against live local comps.
Looking to buy here? Search homes for sale →
What’s your home worth in your area?
A real valuation with real comps from a local listing agent, not an instant algorithm. Response within one business day.
Schools serving nearby communities
We do not have a confirmed school assignment for Palencia. These are the public schools most often assigned to other communities in ZIP 32095; zones change and vary by address, so confirm with the district before you buy.
- Pacetti Bay Middle School · 6-8 · FLDOE grade A (assigned to 7 nearby communities)
- Tocoi Creek High School · 9-12 · FLDOE grade A (assigned to 6 nearby communities)
- Sebastian Middle School · 6-8 · FLDOE grade A (assigned to 6 nearby communities)
- St. Augustine High School · 9-12 · FLDOE grade A (assigned to 6 nearby communities)
- Wards Creek Elementary School · PreK-5 · FLDOE grade A (assigned to 4 nearby communities)
Assignments from district data for neighboring communities; grades are official Florida Department of Education school grades (2025-26).